Download
1 / 31
310 likes | 320 Views
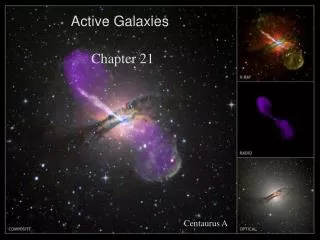
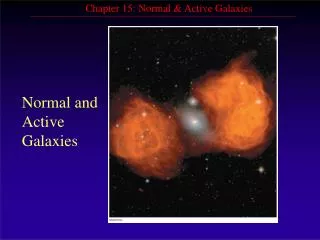
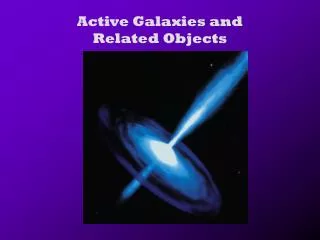
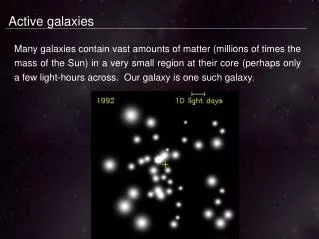
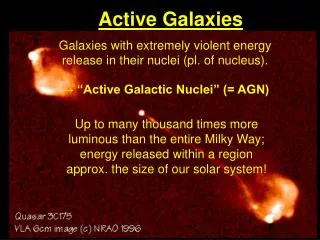
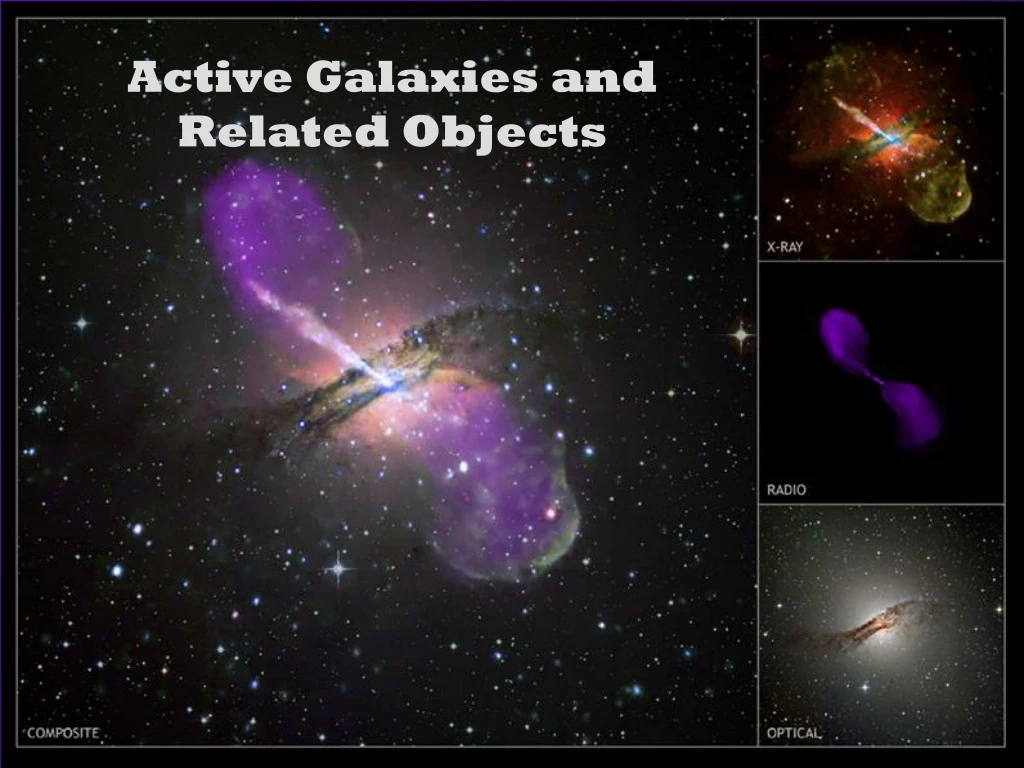
Active Galaxies and Related Objects. What are Active Galactic Nuclei (AGN)? Galaxies with a source of non-stellar emission arising in the nucleus (excessive UV, IR, radio and X-ray light). Central Black Hole accreting material from host galaxy (Lynden-Bell 1969).

E N D
What are Active Galactic Nuclei (AGN)? • Galaxies with a source of non-stellar emission arising in the nucleus (excessive UV, IR, radio and X-ray light) Central Black Hole accreting material from host galaxy (Lynden-Bell 1969) Quasars– luminous (MB<-23) objects with broad emission lines, distant, some are strong radio sources Seyferts– fainter (MB>-23), most identified locally, spiral hosts Sey 1s– broad emission lines Sey 2s– narrow emission lines Starbursts – Extreme star formation in addition to black hole accretion in the nucleus Radio Galaxies – display excess radio emission and jets ULIRGS – ultra-luminous IR galaxies
Quasars – first detected in 1960s as radio sources with star-like optical counterparts • MB < -23, strong nonthermal continuum, broad permitted (~104 km/s) and narrow forbidden (~102-3 km/s) emission lines • Gravitational force required to prevent rapidly moving clouds that produce these broad emission lines from escaping the nucleus ~ 108 – 109 Msun • It was later realized that most quasars were not particularly bright in radio emission - Radio quiet (RQQ) • Radio loud (RLQ) - 5-10% of all quasars • RL = log(Lradio/Lopt) • Radio components for RLQs are 1-2 orders of magnitude brighter than radio galaxies (coming up next....)
Quasar host galaxies • difficult to detect due to brightness of AGN • appear to be a mixed bag of galaxy types - from disturbed galaxies to normal ellipticals and early type spirals.
Quasar Spectra: Lyman Alpha Forest QSO spectra reveal some spectral features not associated with the quasar. These narrow absorption lines are caused by intervening galaxy halos between us and the QSO. Redshifts of the material will be equal to or less than the QSO. Occurs as Lyman alpha absorption since this is the lowest excitation level for Hydrogen gas found in galaxy halos. Can be used to measure extent of galaxy halos and map out large scale structure.
Quasar Spectra: Broad Absorption Lines (BALs) Occurs when quasar is viewed along the l.o.s. of intervening, fast-moving material, possibly ejected from the quasar BALs shown in red SDSS BALQSOs from Trump et al. 2006
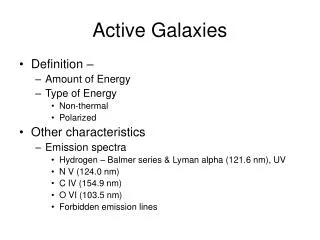
Seyfert galaxieswere first identified by Carl Seyfert in 1943. He defined this class based on observational characteristics: Almost all the luminosity comes from a small (unresolved) region at the center of the galaxy – the galactic nucleus. Nuclei have MB > -23 (arbitrary dividing line between quasars/seyferts) NGC 4151
Seyfert galaxy spectra fall into two classes • broad & narrow emission line spectra (like quasars – Seyfert type 1) • narrow emission line only spectra (Seyfert type 2) Seyfert 1s: Broad and narrow lines (BLAGNs) Seyfert 2s: Only narrow lines (NLAGNs)
Seyfert 2 galaxies (Narrow-Line AGN) • can be differentiated from normal emission line galaxies through the flux ratios of certain emission lines. • shape of the underlying ionizing source determines how many photons are available to produce particular emission lines. Kewley et al (2006) – red line shows extreme starburst, dashed line separates most AGN from star-forming galaxies
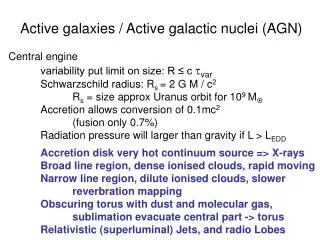
Structure of AGNs and Unified Theory Central Black Hole Rs = 3x10¹¹ m or 2 AU for 108 Msun (Rs = 2GMBH/c2 ~ 3 x (MBH/M) km) Accretion disk UV/visible light from region 1012 - 1013m (X-rays come from a hot corona that surrounds the disk) Jets – ionized gas from accretion disk spirals along magnetic field lines away from the disk • Broad Line Region • size is few light-days to months across (from reverberation mapping) • gas densities > 109 /cm3 • stratified (higher-ionization lines from clouds closer to nucleus) • outer edge defined by dust sublimation radius (1500K) • Obscuring Torus • Dusty structure that blocks view of inner region • May be composed of different absorbing components on different scales (pc-scale to hundreds of pc) • Narrow Line Region • few kpc across • lower gas density ~103/cm3 • part of the host galaxy ISM near galaxy center
Structure of AGNs and Unified Theory Seyfert 2 Observer is looking at blackhole “edge-on” through the surrounding dusty torus - does not see broad emission lines produced by gas near BH Quasar/Seyfert 1 Observer is looking into the center of the accretion disk, viewing motions of gas near blackhole - sees broad emission lines /BL Lac
Variability in AGN • QSOs and Seyfert nuclei have long been recognized as variable • Optical flux changes occur on timescales of months to years - modeled by DRW with characteristic timescale and max amplitude at long timescales (MacLeod et al. 2010 • Cause of variability? – thermal fluctuations in accretion disk or changes to accretion rate (for longer term variability) (Kelly + 09) (Kozlowski 17) Variability occurs at most wavelengths - X-rays through radio Fluctuations originate from a region no more than a ~few light weeks across
Variability in AGN • Variability amplitude is correlated with several AGN parameters (e.g. Lbol, λ, Mbh) (Trevese+ 1994) Fainter AGN have a higher amplitude of variability more variable AGN seem to be accreting at a lower rate. (Oleas, Podjed & Sarajedini, in prep) (Gallastegui & Sarajedini 2014)
Blazars • Strongly variable, highly polarized continuum, weak/absent emission lines • Variability faster and higher amplitude than normal quasars and Seyferts • BL Lac - high polarization, emission lines have low equivalent width • OVVs (Optically Violent Variables) - lower polarization, emission line EW decreases as continuum brightens Light Curve Spectrum
Radio Galaxies • Emit primarily at radio wavelengths (>108 Lsun) (MW emits ~2500 Lsun in radio) • Radio emission is highly polarized synchrotron radiation • Radio and optical morphology can be quite different! • Host galaxies are generally Elliptical/S0 • Radio morphology first classified by Fanaroff & Riley (1974) • FR I: less luminous, 2-sided jets brightest closest to core and dominate over radio lobes • FR II: more luminous, edge-brightened radio lobes dominate over 1-sided jet (due to Doppler boosting of approaching jet and deboosting of receding jet) • Spectroscopic classification of radio galaxies • NLRGs (Narrow line …): like Seyfert 2s; FR I or II • BLRGs (Broad line …): like Seyfert 1s; FR II only
FR I - 3C 47 FR II - 3C 449
~1 Mpc Radio Galaxies Radio image of the FR II radio galaxy Cygnus A. The lobes occur where the jets plow into intracluster gas.
Jet and Core in M87 at optical/radio wavelengths. ~2 kpc The jet is a series of distinct “blobs”, optically thin and brightest at low radio frequencies – L ~ ν-α where 0.7 < α < 1.2 ejected by the galaxy nucleus, moving at up to half the speed of light Core is just ~few pc across, optically thick and brightest at higher frequencies – α = 0
Superluminal Motion of Jets For object moving distance r below: x = r cos , y = r sin and t = r/v Light from P takes x/c less time to reach us than light emitted from O. Time the observer sees for object to travel from O to P is tapp = t - x/c tapp = (r/v) - (r/c) cos tapp = (r/v) (1 - cos ) Apparent velocity across sky vapp = y/tapp vapp = (v sin )/(1 - cos ) object moving at v radio jet in 3C273 For v << c, is close to 0 and vapp = v sin For v close to c, vapp can be >> v and even greater than c.
(U)LIRG’s - (Ultra) Luminous IR Galaxies • First detected in IRAS all-sky survey (infrared – 12 to 100 microns) • Galaxies that emit most of their light in IR LIR > 1012Lsun • (1011 Lsun for LIRGS) • Few in local universe; most beyond z > 1 • Most luminous are undergoing mergers • IR light is likely a combination of dust reprocessed AGN emission and starbursts (Gas streams converge from different directions causing shocks which compress material and trigger star formation) • Some AGN may manifest as ULIRGs during different stages of evolution. Nicmos Near-IR Image of IRAS selected ULIRG
Powering Active Galactic Nuclei • A compact central source – blackhole - produces intense gravitational field. MBH = 106 - 109 Msun • Infalling gas forms an accretion disk around the black hole. • (3) As the gas spirals inward, friction heats it to extremely high temperatures; emission from the accretion disk at different radii (T > 104 K) accounts for optical thru soft X-ray continuum. • (4) Some of the gas is driven out into jets focused by magnetic fields.
How efficient is AGN energy production? Some fraction of the infalling mass is converted into energy (the rest goes into building BH mass). Matter is heated to high temps by dissipation in accretion disk and radiates away its gravitational potential energy. BH radius is Rs=2GM/c2 = 0.25 M8 light hours. What energy is available (via gravitational potential energy) for a mass m falling from far away to the Rs? Emax≅ GMm/Rs Substituting equation for Rs Emax≅ (1/2)mc2 (~up to half the rest energy) Energy generation rate (Luminosity) depends on rate of mass infall Lmax = (1/2)(dm/dt)c2 Infalling matter must spiral in for most energy to escape… The efficiency of this conversion is typically ~10% (η=0.1) for AGN L = η(dm/dt)c2 Consuming 1 – 10 solar masses per year, black hole accretion disk can radiate ~100 – 1000 LMilkyWay.
So...can you just shovel in mass at higher and higher rates to create a superluminous AGN? The Eddington Limit – the maximum L for a given black hole mass (any higher and radiation pressure will blow away surrounding, accreting gas) Force caused by outward flow of photons balances gravitational force of infalling matter (assuming pure ionized H gas) σeL / (4πr2c) = GMbhmp / r2 LE = 4πcGMbhmp/σe = 3.3x10¹²L (Mbh/108M) If L is greater than LE, ionized gas will be accelerated outward and accretion will cease. This leads to a maximum accretion rate for black holes: ME = LE / ηc2 = 2M/yr (Mbh/108M) (0.1/η) The Eddington ratio is then m = M / ME or L / LE . . . .
The Milky Way’s Blackhole All galaxies may contain SMBHs at their centers, with their appearance as AGN dependent on the availability of fuel in the vicinity of BH. The Milky Way galaxy is an example of a “starved” SMBH – low Eddington ratio Radio image (10 pc across) shows feature known as SgrA* - thought to be position of SMBH IR image showing stars near the central parsec - can be used to estimate BH mass Radio image (80 pc across) shows feature SgrA and radio filaments
Measure proper motions of stars in GC • Adaptive optics at Keck improved ground-based resolution to 0.5” in IR (stellar positions measured to 0.002”) • 90 stars identified and proper motions (largest at 1400 km/s!) centered about SgrA* to within 0.1” • Velocities consistent with Keplarian motion (all mass at center) • M = 2.6 +/- 0.2 x 10⁶ Msun
Chandra X-ray image of Sgr A* showing nucleus and several thousand other X-ray sources. • During 2-week observation period, several X-ray flares occurred. • Rapidity of flares indicates they originate near the Schwarzchild radius of the BH. • Even during the flares, X-ray emission from the nucleus is relatively weak. Suggests that Sgr A* is a starved black hole, possibly because explosive events in the past have cleared much of the gas from around it. The Milky Way’s Blackhole – X-ray Emission
Blackhole Mass - Bulge Mass Relation • clear relationship between mass of spheriodal component of host galaxy and blackhole mass • indicates connection between galaxy formation (star formation) and growth/evolution of central blackhole (Gebhardt et al. 2000; Ferrarese & Merritt 2000)
Active Galaxies as part of Galaxy Evolution • As small galaxies merge to form larger ones,blackholesmay form at the nucleus (ULIRG stage?) • With plenty of fuel available early on (accretion triggered by merger?), the galaxy light is dominated by emission from accretion disk (Quasar). Feedback from AGN radiation may slow/stop star formation in the host galaxy, setting spheriodal component size • Additional mergers and depletion of fuel may result in powerful radio galaxies and Seyfert galaxies. • Further fuel depletion results in a normal galaxy with a dormant blackhole at the nucleus.
Active Galaxies as part of Galaxy Evolution AGN phase triggered as a result of galaxy mergers (Hopkins et al 2008)
Active Galaxies as part of Galaxy Evolution Hopkins et al. (2006) Red Sequence Blue Cloud