Download
1 / 17
170 likes | 174 Views
This paper presents new algorithms for estimating fault coverage in non-random functional input sequences, with a focus on large non-scan circuits. The algorithms use dominator analysis and reconvergence techniques to effectively estimate the coverage. Results show that the proposed algorithms provide accurate estimates.

E N D
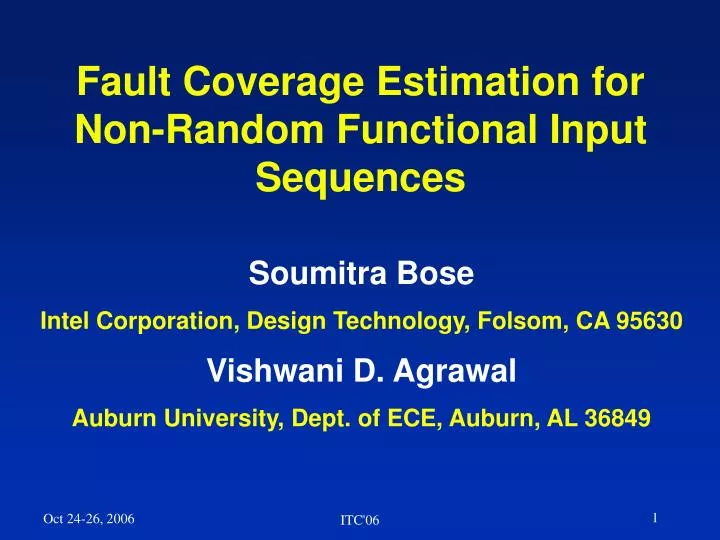
Fault Coverage Estimation for Non-Random Functional Input Sequences Soumitra Bose Intel Corporation, Design Technology, Folsom, CA 95630 Vishwani D. Agrawal Auburn University, Dept. of ECE, Auburn, AL 36849 ITC'06
Outline • Problem statement • Background • Motivating examples • New algorithms • Results • Conclusion ITC'06
Problem Statement • Fault simulation of non-scan circuits is needed for • Finding compact high fault coverage vectors for testing • Finding test points for DFT • Expensive for • Large non-scan or partial-scan circuits • Long functional (non-random) verification vector sequences • Motivation • Exact fault simulation is too expensive • Statistical fault simulator is a useful tool, but needs accuracy • In coverage estimation • In identifying faults not detectable by vector sequence ITC'06
Dominator Fanout stem Background • Approximate fault simulation • Per-vector analysis • Critical path tracing (CPT), Abramovici et al., IEEE D&T 1984. • Necessary conditions, Akers et al., ITC 1990. • Post-simulation analysis, Stafan, Jain and Agrawal, IEEE-D&T 1985. • Dominator analysis in ATPG, Kirkland and Mercer, ITC 1987. Fault detection at fanout stem depends on signal states in this part and the observability of the dominator. ITC'06
Stafan: A Tutorial Example Incorrectly detected faults OB0=1.0, OB1=0.0 (observabilities) C0=0.4, C1=0.6 (controllabilities) S=0.4 (sensitization count) sa0 sa1 Detected faults 11001 sa1 00000 11001 C0=0.4 C1=0.6 sa1 sa1 C0=1.0 C1=0.0 OB0=1.0 OB1=1.0 C0=0.4 C1=0.6 S=1.0 00110 OB0=1.0 OB1=1.0 C0=0.6, C1=0.4 S=0.6 OB0=0.0 OB1=1.0 OB0=1.0, OB1=0.0 pd: Prob(sa0 detected) = C1 × OB1, Prob(sa1 detected) = C0 × OB0 Threshold detection by N vectors: PD(N) = 1 – (1 – pd)N ≥ 0.5 ITC'06
Motivation: A Three-Vector Example Probability of detection (PD) over entire sequence depends on: (1) Number of vectors (N) (2) Per vector detection probability (pd) PD = 1 – ( 1 – pd )N (3) b0 = 1/3 * 2/3 = 2/9 [000] [111] sa1 [011] (2) b1 = 1/3 [110] (1) b0 = 1 [110] [001] [000] [111] PD = 1 – (1 – 2 / 9)3 = 0.53 ≥ 0.5 Fault is detected (correct decision) ITC'06
Motivation: Example of Correlated Vectors Same example with first vector repeated 5 times at the end: (3) b0 = 1/8 * 2/8 = 1/32 [00000000] [11111111] sa1 [01100000] (2) b1 = 1/8 (1) b0 = 1 [11011111] [11011111] [00100000] [00000000] [11111111] PD = 1 – (1 – 1/32)8 = 0.22 ≤ 0.5 Fault not detected (incorrect decision). ITC'06
Outline of New Algorithm • Upper Bounding: find faults that cannot be detected • Graph dominators: necessary conditions for detection • Opposite parity reconvergence: blocked propagation • Equal parity reconvergence: multiple path propagation • Effective length of sequence: estimate “new” content • Track input combinations for each gate • Collect Stafan-like statistics only for new vectors • Detection Prob, PD = 1 – (1 – pd) Neff ITC'06
Algorithm: Fanout Reconvergence (I) Portion of c17: Fanout G1 reconverges with same inversion parity at G5. Same vector applied twice: 11 G2 00 11 11 G1 11 G5 00 sa0 00 sa1 G3 11 Detected faults found not detected due to stafan error Negative errors: Stafan finds G1 output to be unobservable. Structural analysis: Stem G1 has two same parity paths {G2 and G3}. Signal monitoring: Only pattern 0XX0 can make stem G1 unobservable Since 0XX0 did not occur G1 is observable. ITC'06
Algorithm: Fanout Reconvergence (II) Portion of c17: Fanout I2 reconverges with different inversion parities at G4. Undetected fault found detected due to stafan error 10 I1 01 G0 sa0 G4 10 I2 11 11 10 I4 G2 00 G1 11 I3 Positive error: When observable fanouts of I2 are treated as independent. Structural analysis: Fanouts paths {G0, and G1-G2} have different parities. Signal monitoring: Propagation through G0: I1=1 and (I3=0 or I4=0) is false Propagation through G1-G2: {I3=1 and I4=1} and I1=0 is false I2 is unobservable ITC'06
Neff Neff = 3, PD = 1 – (1 – 2/9) = 0.53 ≥ 0.5 Correctly estimated as detected. Algorithm: Effective Length Estimation Rework previous example of repeated vectors: (3) b0 = 1/3 × 2/3 = 2/9 [00000000] [11111111] sa1 [01100000] (2) b1 = 1/3 (1) b0 = 1 [11011111] [11011111] [00100000] [00000000] [11111111] ITC'06
Results for Two Vector Sequences • Simulation of combinational benchmark circuits. • Short sequence: 100 random vectors. • Long sequence: 2000+ vectors. Constructed from short sequence. • Both sequences have same coverage. • Simulation of combinational benchmark circuits. • Short sequence: 100 random vectors. • Long sequence: 2000+ vectors. Constructed from short sequence. • Both sequences have same coverage. 100 Random vectors Vectors repeated 1-100 times 50 ITC'06
Setting Threshold for Fault Detection • Consider a fault as detected if PD(N) = 1 – [1 – pd(Neff)]Neff ≥ p • Upper bound coverage, p = 0.99; result is very close to analytical upper bound coverage (VTS’06). • Lower bound coverage, p = 0.01. • For average value of coverage: • p = 0.50 (traditionally used value) • p = 0.63 (an improved threshold proposed in this paper) ITC'06
Results: Benchmark Circuits Coverage estimation error 5 – 69% ITC'06
New Fault Coverage Estimate for c2670 80 Statistical upper bound, PD≥ 0.99 or VTS’06 paper 60 Statistical lower bound, PD≥ 0.01 40 Fault coverage (%) New estimate, PD≥ 0.63 Exact fault simulation 20 Stafan 0 1 10 100 1000 10000 Number of vectors ITC'06
Upper bound (VTS’06) New estimate Fault simulation Fault coverage (%) Individual sequence coverages by fault simulation 0 5 10 15 20 25 30 40 Functional vector sequences Coverage Estimation for a Large Design ITC'06
Conclusion • Estimation errors in Stafan are due to reconverging fanouts: • Positive error: Undetected faults estimated as detected. • Negative error: Detected faults estimated as undetected. • Upper Bounding improvements: • Positive errors reduced by dominator analysis. • Negative errors reduced by reconvergence analysis. • Structural analysis of dominators and signal monitoring finds the effective length (Neff) of non-random functional input sequences. • Improved analysis is useful for • Test development – vector selection from functional sequences. • DFT – test point selection (VTS’06 paper). ITC'06