Download
1 / 42
430 likes | 572 Views
RNPS 25 Identifying systems for carbon sequestration and increased productivity in semi-arid tropical environments. ICRISAT Co-PI Dr. T.J. Rego Dr. K.P.C. Rao Mr. P. Pathak Dr. Piara Singh. NBSS & LUP Dr. Tapas Bhattacharyya Dr. P. Chandran DR. S.K. Ray Dr. (Mrs.) C. Mandal

E N D
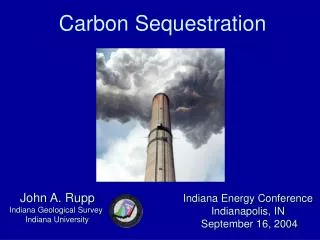
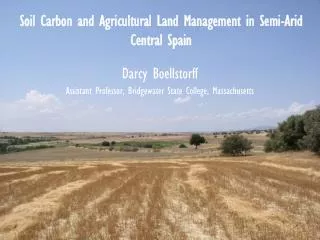
RNPS 25 Identifying systems for carbon sequestration and increased productivity in semi-arid tropical environments
ICRISAT Co-PI Dr. T.J. Rego Dr. K.P.C. Rao Mr. P. Pathak Dr. Piara Singh NBSS & LUP Dr. Tapas Bhattacharyya Dr. P. Chandran DR. S.K. Ray Dr. (Mrs.) C. Mandal Dr. D.K. Pal Dr. M.V. Venugopalan Mr. S.L. Durge Dr. P. Srivastava Collaborating Scientists within InstitutionsPrincipal InvestigatorDr. S.P.Wani CRIDA Dr. V. Ramesh Dr. K.L. Sharma DR. M. Vanaja IISS Dr. M.C. Manna Dr. K. Bandyopadhyay DR. T.R. Rupa
Objectives • Identify the potential carbon sequestration production systems in the SAT benchmark sites and establish relationship amongst different factors with the carbon stock and systems productivity. • Evaluate and validate the existing simulation models for predicting the performance of different systems for carbon sequestration.
NBSS & LUP Soil sample collection & distribution from selected BM spots Site characteristics & information on soils & management Mineralogy of clay + silt Smectite quantity Bulk density Particle size density Structure HC, COLE pH, EC,CEC Organic C Extractable Cations Inorganic C CaCO3 CO2 Clay IISS Soil Analysis WSA WSC WS Carbon POM Passive pools DHA Available P Responsibilities of participating institutions CRIDA • Available S • Total P reading • Total S reading • Meteorological • Agronomic • Infiltration • Respiration ICRISAT • WHC • Organic C • Total P • SMBC • SMBN • Respiration • Net N mineralisation • Total & Avail. N • Plant C & N • Modeling work • Modeling work
Progress • Benchmark sites identified (20 sites covering 25 spots) • Site characteristics and information on soils and management practices collected for each site • Soil samples collected (horizon wise) for analysis of physico-chemical and biological properties
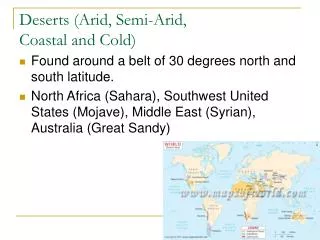
Grouping of BM Spots under different bio-climate • SH(M): DADARGHUGRI, KARKELI, KHERI • SH(D): LINGA, PANJRI, NABIBAGH, BORIPANI • SA(M): SAROL, ASRA, VIJAYPURA, JHALIPURA, BHATUMBRA • SA(D): PARAL, KOVILPATTY, PALATHURAI, SEMLA, SOKHDA, KAUKUNTLA, JAJAPUR,HAYATNAGAR, KASIREDDIPALLI, PATANCHERU, KONHERI, KALWAN • A : TELIGI
LINGA BM Spot 1 Systems and Managements • Systems: • Horticultural ( Orange) (HS) • Agricultural ( Soybean-Wheat/Gram) (AS) • Managements HM: High Management FM: Farmers’ Management LM: Low Management
LINGASERIES HS (Orange)--LM Pedon-2
PARAL SERIES AS : Cotton-Pigeonpea/ Sorghum(LM)
Distribution of BD with depth Sub-humid (dry) • BD is higher in FM • It is lowest in HM • It is higher in HS
Distribution of H.C. with depth Sub-humid (dry) • HC shows the trend HM < FM <LM • This trend indicates indirect relation with SOC content • Relatively high pH and E.S.P. support low HC in HM
Mean weight diameter (MWD) • Ecosystems: Forest system > Agricultural & Horticultural system • Boripani series(Forest ecosystem) in highest range (4.58 –5.96 mm) • Farmers management > Low & High management practices • Management practices: FM > LM & HM • Black soils Linga, Asra & Paral < Panjri, Nabibagh, Sarol & Kovilpatti • Red soils • Vijayapura & Palathurai series as high as Panjri, Nabibagh, Sarol & Kovilpatti
Moisture retention characteristics • Highest moisture retention in Asra (0.480 g g-1 at 0.33 bar) and Linga (0.447 g g-1 at 0.33 bar) series of Maharashtra • Lowest moisture retention in Palathurai series (0.037 g g-1 at 15 bars) TN < Vijayapura series (0.041 g g-1 at 15 bars), Karnataka. • Moisture retention increased with increase in depth (exception Palathurai series reduced after 46-95 cm depth. • Black soil series: HM > FM • Red soil series (Vijayapura series): FM>HM
Total N (ppm) in different cropping systems of different soil series in India
Total Phosporous (ppm) in different cropping systems of different soil series in India
Nagpur Forest Tot P 0 100 200 300 400 500 600 700 0-16 16-44 Soil depth 44-57 57-94 Reserve forest
Distribution of Available Sulphur (ppm) in the soil profiles of LINGA Series( Sub-humid dry) at Nagpur
Distribution of available Sulphur (ppm) in the soil profiles of ASRA series(semi-arid moist), Amravati (MS)
Distribution of available Sulphur in the soil profile of Kovilpatti series(Arid) at Tuthukudi (TN)
Organic Carbon in different cropping system for different soil series in India Distribution of SOC with Depth Sub-humid (dry) • SOC decreases with depth • SOC decreases in the order LM>FM>HM • SOC in LM is higher throughout the profile even at greater depth
Semi-arid (moist) Distribution of SOC with Depth in Asra Series • SOC in FM(org) and FM show similar decreasing trend • FM (org) maitains higher SOC even in greater depth • HM registers much higher SOC even at greater depth due to addition of sunhemp in the crop rotation
Microbial biomass-C (mg C kg-1 soil) for different cropping systems in different locations of India Amaravathi Asra Microbial Biomass-C 0 100 200 300 400 0-14 40-59 Sss 91-150 Cotton/Ppea-FM Soy/Ppea-FM Soy-Gram-FM
Microbial biomass-N (mg N kg -1 soil) in different cropping system for different soil series in India
SYSTEM INTERACTION Sub-humid (dry)
Modeling Work • Identified CENTURY model to assess carbon stocks at all locations targeted by this project • APSIM and DSSAT models are the crop growth models to assess the changes in soil productivity associated with changes in soil carbon • Work on calibration of century model initiated
Why century model to assess C stocks? • Ability to model a diverse array of ecosystems • Capability to simulate a wide range of land use and management options • Possibility to alter the rates of various processes using observed data • Extensive use and testing around the world on a diverse array of systems • User friendly front end.
Reasons for Choosing APSIM Model • Soil is central to the model & changes in it due to cropping and management are accumulated and carried forward • Soil N and Residue modules which simulates the changes in SOM represent the process adequately • Its plug-in & pull out approach • ICRISAT has necessary expertise to assist in use of APSIM
Simulation of Soil Organic pools in DSSAT • A new input file for all the crop models has been implemented in DSSAT version 3.5. It is named as SOILN 980.SOL. • Many of the Co-efficients involved in simulating the decomposition of soil organic matter have been externalized. • This allows uses to specify their own coefficients for simulating long-term simulation.
Student’s work • Objectives are • To identify the potential cropping systems and appropriate management practices for carbon sequestration at selected 11 benchmark spots(Long term experiment sites) in the semi-arid environments of India • To evaluate and validate existing simulation models for predicting the performance of different systems for carbon sequestration in semi-arid tropics • Work is in progress
Conclusions • Cooperating centers have done exceeding well for all the BM sites. • Recently held review and planning meeting decided to add 3 BM spots to cover varying conditions in the eco-regions. • Difficult task of analyzing and archiving the data is ahead of us which we are confident to do it ahead of plan.
Looking Forward • All datasets will be assembled and compiled centrally following Aridity Index • Website has been launched • Selected datasets put on the websites • Analysis & relation between various parameters and calculation of various stocks and pools will be undertaken
Looking Forward (contd.) • Analysis of long term experiment sites by student will result in identifying suitable C sequestration systems in SAT. • Simulation C modeling using appropriate models will be enable to extrapolate the results from BM sites to eco-regional level.