Download
1 / 23
230 likes | 615 Views
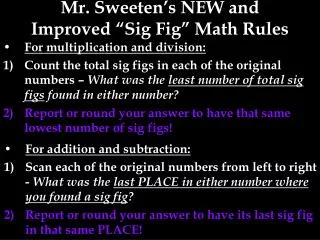
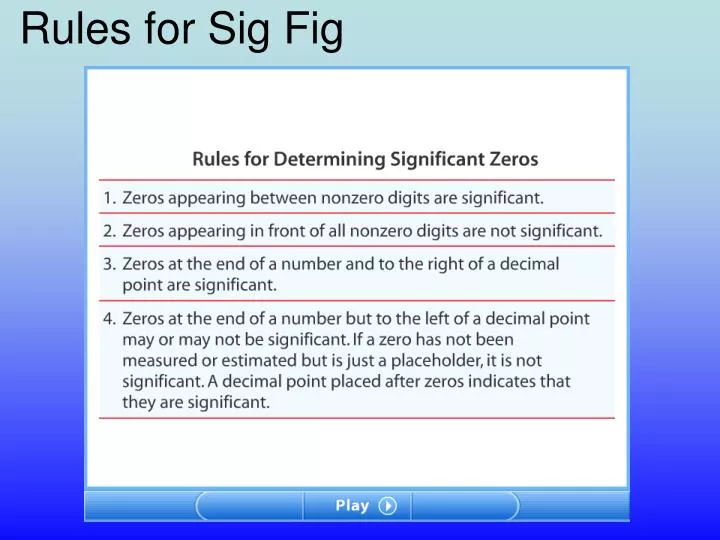
Rules for Sig Fig. Rules for Calculating with Significant Figures. Rules for Rounding in Calculations. Rules for Rounding in Calculations. Objectives. Interpret data in tables and graphs, and recognize equations that summarize data.

E N D
Objectives • Interpretdata in tables and graphs, and recognize equations that summarize data. • Distinguishbetween conventions for abbreviating units and quantities. • Usedimensional analysis to check the validity of equations. • Performorder-of-magnitude calculations.
Mathematics and Physics • Tables, graphs,andequationscan make data easier to understand. • For example, consider an experiment to test Galileo’s hypothesis that all objects fall at the same rate in the absence of air resistance. • In this experiment, a table-tennis ball and a golf ball are dropped in a vacuum. • The results are recorded as a set of numbers corresponding to the times of the fall and the distance each ball falls. • A convenient way to organize the data is to form a table, as shown on the next slide.
Data from Dropped-Ball Experiment A clear trend can be seen in the data. The more time that passes after each ball is dropped, the farther the ball falls.
Graph from Dropped-Ball Experiment One method for analyzing the data is to construct a graph of the distance the balls have fallen versus the elapsed time since they were released. The shape of the graph provides information about the relationship between time and distance.
Physics Equations • Physicists useequationsto describe measured or predicted relationships between physical quantities. • Variablesand other specific quantities are abbreviated with letters that areboldfacedoritalicized. • Unitsare abbreviated with regular letters, sometimes called roman letters. • Two tools for evaluating physics equations aredimensional analysisandorder-of-magnitude estimates.
Equation from Dropped-Ball Experiment • We can use the following equation to describe the relationship between the variables in the dropped-ball experiment: (change in position in meters) = 4.9 (time in seconds)2 • With symbols, the word equation above can be written as follows: Dy = 4.9(Dt)2 • The Greek letterD(delta) means“change in.”The abbreviationDyindicates thevertical changeina ball’s position from its starting point, andDtindicates thetime elapsed. • This equation allows you toreproduce the graphandmake predictionsabout the change in position for any time.
Chapter 1 Standardized Test Prep Multiple Choice 1. What area of physics deals with the subjects of heat and temperature? A. mechanics B. thermodynamics C. electrodynamics D. quantum mechanics
Chapter 1 Standardized Test Prep Multiple Choice 1. What area of physics deals with the subjects of heat and temperature? A. mechanics B. thermodynamics C. electrodynamics D. quantum mechanics
Chapter 1 Standardized Test Prep Multiple Choice, continued 2. What area of physics deals with the behavior of subatomic particles? F. mechanics G. thermodynamics H. electrodynamics J. quantum mechanics
Chapter 1 Standardized Test Prep Multiple Choice, continued 2. What area of physics deals with the behavior of subatomic particles? F. mechanics G. thermodynamics H. electrodynamics J. quantum mechanics
Chapter 1 Standardized Test Prep Multiple Choice, continued 3. What term describes a set of particles or interacting components considered to be a distinct physical entity for the purpose of study? A. system B. model C. hypothesis D. controlled experiment
Chapter 1 Standardized Test Prep Multiple Choice, continued 3. What term describes a set of particles or interacting components considered to be a distinct physical entity for the purpose of study? A. system B. model C. hypothesis D. controlled experiment
Chapter 1 Standardized Test Prep Multiple Choice, continued 4. What is the SI base unit for length? F. inch G. foot H. meter J. kilometer
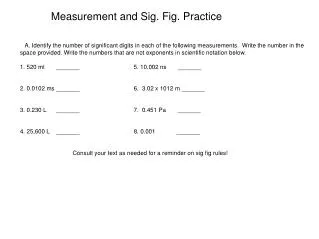
Chapter 1 Standardized Test Prep Short Response 13. Determine the number of significant figures in each of the following measurements. A. 0.0057 kg B. 5.70 g C. 6070 m D. 6.070 103 m
Chapter 1 Standardized Test Prep Short Response 13. Determine the number of significant figures in each of the following measurements. A. 0.0057 kg B. 5.70 g C. 6070 m D. 6.070 103 m Answers: A. 2; B. 3; C. 3; D. 4
Chapter 1 Standardized Test Prep Short Response, continued 14. Calculate the following sum, and express the answer in meters. Follow the rules for significant figures. (25.873 km) + (1024 m) + (3.0 102 cm)
Chapter 1 Standardized Test Prep Short Response, continued 14. Calculate the following sum, and express the answer in meters. Follow the rules for significant figures. (25.873 km) + (1024 m) + (3.0 102 cm) Answer: 26 897 m