Download
1 / 1
10 likes | 104 Views
Program # 2131. Bayesian networks to classify visual field data A Tucker, 1 V Vinciotti, 1 XH Liu, 1 DF Garway-Heath 2 1 Dept Info Systems and Computing, Brunel University, UK; 2 Moorfields Eye Hospital, London, UK. RESULTS. PURPOSE.

E N D
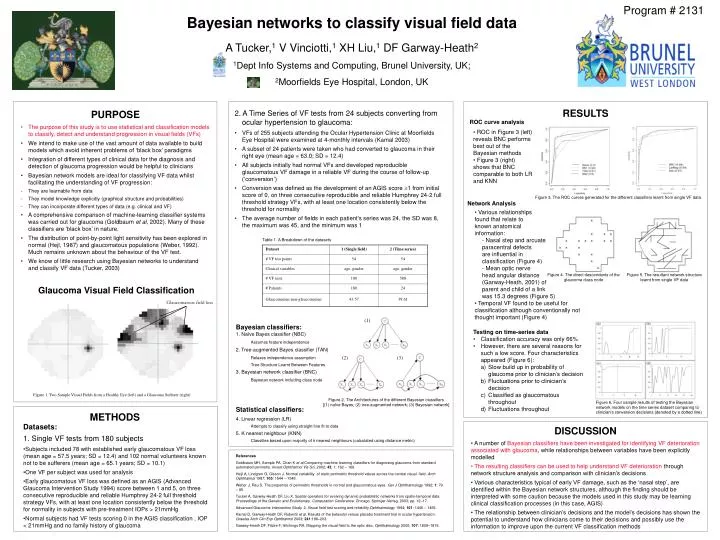
Program # 2131 Bayesian networks to classify visual field data A Tucker,1 V Vinciotti,1 XH Liu,1 DF Garway-Heath2 1Dept Info Systems and Computing, Brunel University, UK; 2Moorfields Eye Hospital, London, UK RESULTS PURPOSE • 2. A Time Series of VF tests from 24 subjects converting from ocular hypertension to glaucoma: • VFs of 255 subjects attending the Ocular Hypertension Clinic at Moorfields Eye Hospital were examined at 4-monthly intervals (Kamal 2003) • A subset of 24 patients were taken who had converted to glaucoma in their right eye (mean age = 63.0; SD = 12.4) • All subjects initially had normal VFs and developed reproducible glaucomatous VF damage in a reliable VF during the course of follow-up (‘conversion’) • Conversion was defined as the development of an AGIS score 1 from initial score of 0, on three consecutive reproducible and reliable Humphrey 24-2 full threshold strategy VFs, with at least one location consistently below the threshold for normality • The average number of fields in each patient's series was 24, the SD was 8, the maximum was 45, and the minimum was 1 ROC curve analysis • The purpose of this study is to use statistical and classification models to classify, detect and understand progression in visual fields (VFs) • We intend to make use of the vast amount of data available to build models which avoid inherent problems of ‘black box’ paradigms • Integration of different types of clinical data for the diagnosis and detection of glaucoma progression would be helpful to clinicians • Bayesian network models are ideal for classifying VF data whilst facilitating the understanding of VF progression: • They are learnable from data • They model knowledge explicitly (graphical structure and probabilities) • They can incorporate different types of data (e.g. clinical and VF) • A comprehensive comparison of machine-learning classifier systems was carried out for glaucoma (Goldbaum et al, 2002). Many of these classifiers are ‘black box’ in nature. • The distribution of point-by-point light sensitivity has been explored in normal (Hejl, 1987) and glaucomatous populations (Weber, 1992). Much remains unknown about the behaviour of the VF test. • We know of little research using Bayesian networks to understand and classify VF data (Tucker, 2003) • ROC in Figure 3 (left) reveals BNC performs best out of the Bayesian methods • Figure 3 (right) shows that BNC comparable to both LR and KNN Figure 3. The ROC curves generated for the different classifiers learnt from single VF data Network Analysis • Various relationships • found that relate to • known anatomical • information: • Nasal step and arcuate • paracentral defects • are influential in • classification (Figure 4) • Mean optic nerve • head angular distance • (Garway-Heath, 2001) of • parent and child of a link • was 15.3 degrees (Figure 5) • Temporal VF found to be useful for • classification although conventionally not thought important (Figure 4) Table 1. A Breakdown of the datasets Figure 4. The direct descendants of the glaucoma class node Figure 5. The resultant network structure learnt from single VF data Glaucoma Visual Field Classification Glaucomatous field loss (1) Bayesian classifiers: 1. Naïve Bayes classifier (NBC) Assumes feature independence 2. Tree-augmented Bayes classifier (TAN) Relaxes independence assumption Tree Structure Learnt Between Features 3. Bayesian network classifier (BNC) Bayesian network including class node • Testing on time-series data • Classification accuracy was only 66% • However, there are several reasons for such a low score. Four characteristics appeared (Figure 6): • Slow build up in probability of glaucoma prior to clinician’s decision • Fluctuations prior to clinician’s decision • Classified as glaucomatous throughout • Fluctuations throughout (2) (3) Figure 1. Two Sample Visual Fields from a Healthy Eye (left) and a Glaucoma Sufferer (right) Figure 2. The Architectures of the different Bayesian classifiers [(1) naïve Bayes; (2) tree-augmented network; (3) Bayesian network] Figure 6. Four sample results of testing the Bayesian network models on the time series dataset comparing to clinician’s conversion decisions (denoted by a dotted line) Statistical classifiers: 4. Linear regression (LR) Attempts to classify using straight line fit to data 5. K nearest neighbour (KNN) Classifies based upon majority of k nearest neighbours (calculated using distance metric) METHODS • Datasets: • 1. Single VF tests from 180 subjects • Subjects included 78 with established early glaucomatous VF loss (mean age = 57.5 years; SD = 12.4)and 102 normal volunteers known not to be sufferers (mean age = 65.1 years; SD = 10.1) • One VF per subject was used for analysis • Early glaucomatous VF loss was defined as an AGIS (Advanced Glaucoma Intervention Study 1994) score between 1 and 5, on three consecutive reproducible and reliable Humphrey 24-2 full threshold strategy VFs, with at least one location consistently below the threshold for normality in subjects with pre-treatment IOPs > 21mmHg • Normal subjects had VF tests scoring 0 in the AGIS classification , IOP < 21mmHg and no family history of glaucoma DISCUSSION • A number of Bayesian classifiers have been investigated for identifying VF deterioration associated with glaucoma, while relationships between variables have been explicitly modelled • The resulting classifiers can be used to help understand VF deterioration through network structure analysis and comparison with clinician’s decisions • Various characteristics typical of early VF damage, such as the ‘nasal step’, are identified within the Bayesian network structures, although the finding should be interpreted with some caution because the models used in this study may be learning clinical classification processes (in this case, AGIS) • The relationship between clinician’s decisions and the model’s decisions has shown the potential to understand how clinicians come to their decisions and possibly use the information to improve upon the current VF classification methods References Goldbaum MH, Sample PA, Chan K et al.Comparing machine learning classifiers for diagnosing glaucoma from standard automated perimetry. Invest Ophthalmol Vis Sci. 2002; 43; 1: 162 – 169. Heijl A, Lindgren G, Olsson J. Normal variability of static perimetric threshold values across the central visual field. Arch Ophthalmol 1987; 105: 1544 – 1549. Weber J, Rau S. The properties of perimetric thresholds in normal and glaucomatous eyes. Ger J Ophthalmology 1992; 1: 79 – 85. Tucker A, Garway-Heath DF, Liu X. Spatial operators for evolving dynamic probabilistic networks from spatio-temporal data. Proceedings of the Genetic and Evolutionary Computation Conference. Chicago: Springer-Verlag, 2003; pp. 12–17. Advanced Glaucoma Intervention Study. 2. Visual field test scoring and reliability.Ophthalmology 1994; 101: 1445 – 1455. Kamal D, Garway-Heath DF, RubenS et al. Results of the betaxolol versus placebo treatment trial in ocular hypertension. Graefes Arch Clin Exp Ophthalmol 2003; 241:196–203. Garway-Heath DF, Fitzke F, Hitchings RA. Mapping the visual field to the optic disc. Ophthalmology 2000;107: 1809–1815.