Download
1 / 1

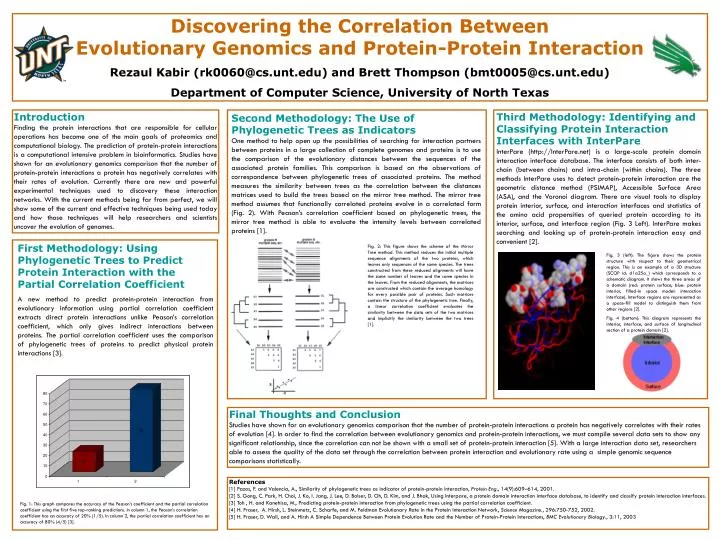
E N D
Fig. 3 (left): The figure shows the protein structure with respect to their geometrical region. This is an example of a 3D structure (SCOP id: d1a25a_) which corresponds to a schematic diagram. It shows the three areas of a domain (red: protein surface, blue: protein interior, filled-in space model: interaction interface). Interface regions are represented as a space-fill model to distinguish them from other regions [2]. Fig. 4 (bottom): This diagram represents the interior, interface, and surface of longitudinal section of a protein domain [2]. Discovering the Correlation Between Evolutionary Genomics and Protein-Protein Interaction Rezaul Kabir (rk0060@cs.unt.edu) and Brett Thompson (bmt0005@cs.unt.edu) Department of Computer Science, University of North Texas Introduction Finding the protein interactions that are responsible for cellular operations has become one of the main goals of proteomics and computational biology. The prediction of protein-protein interactions is a computational intensive problem in bioinformatics. Studies have shown for an evolutionary genomics comparison that the number of protein-protein interactions a protein has negatively correlates with their rates of evolution. Currently there are new and powerful experimental techniques used to discovery these interaction networks.With the current methods being far from perfect, we will show some of the current and effective techniques being used today and how those techniques will help researchers and scientists uncover the evolution of genomes. Third Methodology: Identifying and Classifying Protein Interaction Interfaces with InterPare InterPare (http://InterPare.net) is a large-scale protein domain interaction interface database. The interface consists of both inter-chain (between chains) and intra-chain (within chains). The three methods InterPare uses to detect protein-protein interaction are the geometric distance method (PSIMAP), Accessible Surface Area (ASA), and the Voronoi diagram. There are visual tools to display protein interior, surface, and interaction interfaces and statistics of the amino acid propensities of queried protein according to its interior, surface, and interface region (Fig. 3 Left). InterPare makes searching and looking up of protein-protein interaction easy and convenient [2]. Second Methodology: The Use of Phylogenetic Trees as Indicators One method to help open up the possibilities of searching for interaction partners between proteins in a large collection of complete genomes and proteins is to use the comparison of the evolutionary distances between the sequences of the associated protein families. This comparison is based on the observations of correspondence between phylogenetic trees of associated proteins. The method measures the similarity between trees as the correlation between the distances matrices used to build the trees based on the mirror tree method. The mirror tree method assumes that functionally correlated proteins evolve in a correlated form (Fig. 2). With Peason’s correlation coefficient based on phylogenetic trees, the mirror tree method is able to evaluate the intensity levels between correlated proteins [1]. First Methodology: Using Phylogenetic Trees to Predict Protein Interaction with the Partial Correlation Coefficient A new method to predict protein-protein interaction from evolutionary information using partial correlation coefficient extracts direct protein interactions unlike Peason’s correlation coefficient, which only gives indirect interactions between proteins. The partial correlation coefficient uses the comparison of phylogenetic trees of proteins to predict physical protein interactions [3]. Fig. 2: This figure shows the scheme of the Mirror Tree method. This method reduces the initial multiple sequence alignments of the two proteins, which leaves only sequences of the same species. The trees constructed from these reduced alignments will have the same number of leaves and the same species in the leaves. From the reduced alignments, the matrices are constructed which contain the average homology for every possible pair of proteins. Such matrices contain the structure of the phylogenetic tree. Finally, a linear correlation coefficient evaluates the similarity between the data sets of the two matrices and implicitly the similarity between the two trees [1]. Final Thoughts and Conclusion Studies have shown for an evolutionary genomics comparison that the number of protein-protein interactions a protein has negatively correlates with their rates of evolution [4]. In order to find the correlation between evolutionary genomics and protein-protein interactions, we must compile several data sets to show any significant relationship, since the correlation can not be shown with a small set of protein-protein interaction [5]. With a large interaction data set, researchers able to assess the quality of the data set through the correlation between protein interaction and evolutionary rate using a simple genomic sequence comparisons statistically. References [1] Pazos, F. and Valencia, A., Similarity of phylogenetic trees as indicator of protein-protein interaction, Protein Eng., 14(9):609–614, 2001. [2] S. Gong, C. Park, H. Choi, J. Ko, I. Jang, J. Lee, D. Bolser, D. Oh, D. Kim, and J. Bhak, Using Interpare, a protein domain interaction interface database, to identify and classify protein interaction interfaces. [3] Toh , H. and Kanehisa, M., Predicting protein-protein interaction from phylogenetic trees using the partial correlation coefficient. [4] H. Fraser, A. Hirsh, L. Steinmetz, C. Scharfe, and M. Feldman Evolutionary Rate in the Protein Interaction Network, Science Magazine., 296:750-752, 2002. [5] H. Fraser, D. Wall, and A. Hirsh A Simple Dependence Between Protein Evolution Rate and the Number of Protein-Protein Interactions, BMC Evolutionary Biology., 3:11, 2003 Fig. 1: This graph compares the accuracy of the Peason’s coefficient and the partial correlation coefficient using the first five top-ranking predictions. In column 1, the Peason’s correlation coefficient has an accuracy of 20% (1/5). In column 2, the partial correlation coefficient has an accuracy of 80% (4/5) [3].