Download
1 / 15
150 likes | 227 Views
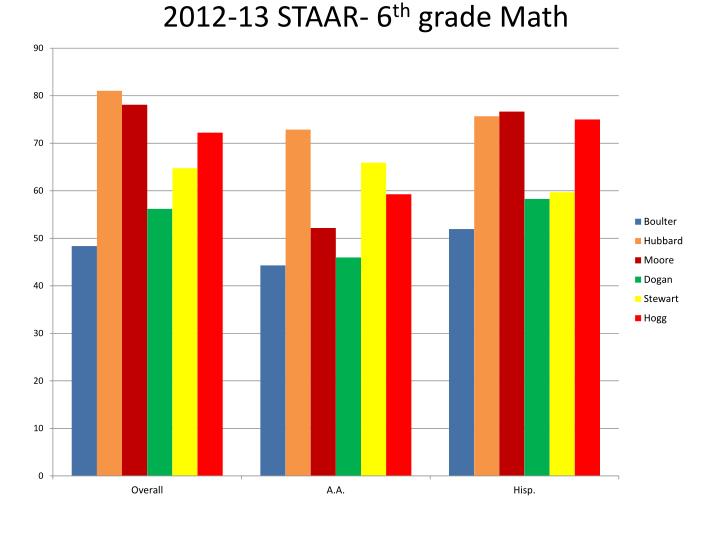
2012-13 STAAR- 6 th grade Math. 2012-13 STAAR- 6 th grade Reading. 2012-13 STAAR- 7 th grade Math. 2012-13 STAAR- 7 th grade Reading. 2012-13 STAAR- 7 th grade Writing. 2012-13 STAAR- 8 th grade Math. 2012-13 STAAR- 8 th grade Reading. 2012-13 STAAR- 8 th grade Science.

E N D
Performance Standards and thePhase-in of STAAR • STAAR Level II – 3 phases • For Grades 3-8: set based on the school year in which the student takes the test Final 2015-16 Phase 2 2013-14 2014-15 Phase 1 2011-12 2012-13 • For 2013 Accountability: ALL STAAR tests are at Level II – Phase 1
WHO: -10 Student Groups -STAAR Reading, Math, & Writing WHAT: Credit based on growth expectations: 1 credit for Meeting Expectations 2 credits for Exceeding Expectations WHO: -All Students -All Test Versions -All Subject Areas WHAT: Credit given for students reaching Level II (satisfactory) performance. WHO: -Only the Eco. Dis. group and the two lowest performing race/ethnicity groups from last year. -All subject areas WHAT: Credit given for students reaching Level II (satisfactory) performance. WHO: -10 Student Groups WHAT: 4-year or 5-year Graduation rate (whichever is higher) AND Percentage of Recommended and Distinguished Grad Plans
Progress • 10 student groups • All Students • 7 Race/Ethnicity • SWD • ELL • Minimum size • 10 for All Students • 25 for other groups • By Subject Area • Reading & Math in 2013 • Based on GROWTH • 1 point for Met • 2 points for Exceeded 2013 Accountability Pass Rate Passing Standard Index 2 Student Progress Index 1 Student Achievement Achievement • All Students Only • Single percentage combined over ALL Subject Areas • ≥ Level II (Phase 1) STAAR • ≥ Met Std Grade 11 TAKS Pass Rate Standard Target = 50 Target = ≈ 5th %ile • Met Standard • Improvement Required Postsecondary • 4-year or 5-year graduation rate (or Annual Dropout Rate) • 10 student groups • % RHSP/DAP • 8 student groups (not SWD or ELL) • STAAR Postsecondary Readiness – Level II Final (2014) Closing Gaps • Eco Dis and 2 lowest Race/Ethnicity groups from prior year • By Subject Area (all subjects) • 1 point for Level II (Phase 1) • 2 points for Level III (2014) Index 4 Postsecondary Readiness Index 3 Closing Performance Gaps Target = 75 Target = 55
System Safeguards Index 1 Targets