Download
1 / 12
120 likes | 203 Views
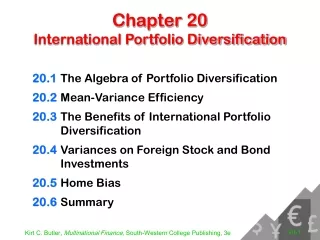
Exhibit 15.1 Portfolio Risk Reduction Through Diversification. Exhibit 15.2 Portfolio Risk Reduction Through International Diversification. Exhibit 15.3 Optimal Domestic Portfolio Construction. Exhibit 15.4 The Internationally Diversified Portfolio Opportunity Set.

E N D
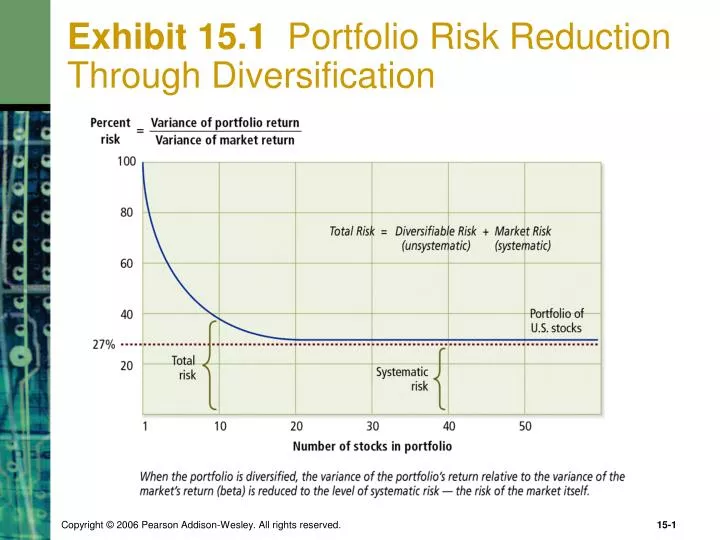
Exhibit 15.1 Portfolio Risk Reduction Through Diversification
Exhibit 15.2 Portfolio Risk Reduction Through International Diversification
Exhibit 15.4 The Internationally Diversified Portfolio Opportunity Set
Exhibit 15.5 The Gains from International Portfolio Diversification
Exhibit 15.6 Alternative Portfolio Profiles Under Varying Asset Weights
Exhibit 15.7 Real Returns and Risks on the Three Major Asset Classes, Globally, 1900–2000
Exhibit 15.8 Correlation Coefficients Between World Equity Markets, 1900–2000
Exhibit 15.9 Summary Statistics of the Monthly Returns for 18 Major Stock Markets, 1977–1996 (all returns converted into U.S. dollars and include all dividends paid)
Exhibit 15.10 Comparison of Selected Correlation Coefficients Between Stock Markets for Two Time Periods (dollar returns)
Exhibit 1 Russell/Mellon Survey of 19 Active Managers, Ending June 30, 2003
Exhibit 2 Annual Historical Excess Returns, Annual Risk, and Sharpe Ratios for Selected Equities and Currencies, January 1978 to February 2003