Download
1 / 6
60 likes | 162 Views
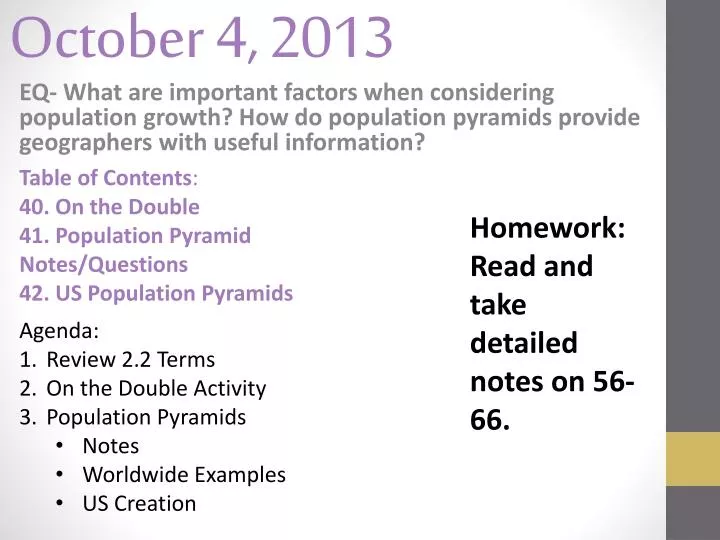
October 4, 2013. Table of Contents : 40. On the Double 41. Population Pyramid Notes/Questions 42. US Population Pyramids. Homework: Read and take detailed notes on 56-66. Agenda: Review 2.2 Terms On the Double Activity Population Pyramids Notes Worldwide Examples US Creation.

E N D
October 4, 2013 Table of Contents: 40. On the Double 41. Population Pyramid Notes/Questions 42. US Population Pyramids Homework: Read and take detailed notes on 56-66. • Agenda: • Review 2.2 Terms • On the Double Activity • Population Pyramids • Notes • Worldwide Examples • US Creation EQ- What are important factors when considering population growth? How do population pyramids provide geographers with useful information?
Population Increase • Crude Birth Rate (CBR)- total number of live births for every 1,000 people • Crude Death Rate (CDR)- total number of deaths for every 1,000 people • Natural Increase Rate (NIR)- % that a pop. grows in a year 1.2 for world • Doubling Time- number of years to double a population at 1.2% = 54 years 95% of NIR is in LDC’s; more than 2% NRI in Africa and Middle East Negative NRI in Europe What are the implications of this????
Other terms to note: • Total Fertility Rate- average number of children a woman will have world- 2.6; more than 6 in many African countries, less than 1.9 in Europe • Infant Mortality Rate- annual number of infant (under 1) deaths per year compared with births highest rates in Africa (close to 100), lowest in Europe (less than 5) minority rates in USA are 2x that of the national IMR • Life Expectancy- average number of years a newborn can expect to live 80 in Europe, 50 in Africa • MDC’s- lower NRI, CBR, TFR, IMR and higher Life expectancy • LDC’s- higher NRI, CBR, TFR, IMR and lower life expectancy`
Population Pyramids • Are there more boy or girl babies? • Are there more elderly men or elderly women? Why do you think? • What shape does your country most closely represent? What can you tell about your country from this? • What are the two biggest age groups in your country? • If you wanted to start a money making business in your country what age group would you target? What product would you make? Why would it be popular?