Download
1 / 15
150 likes | 339 Views
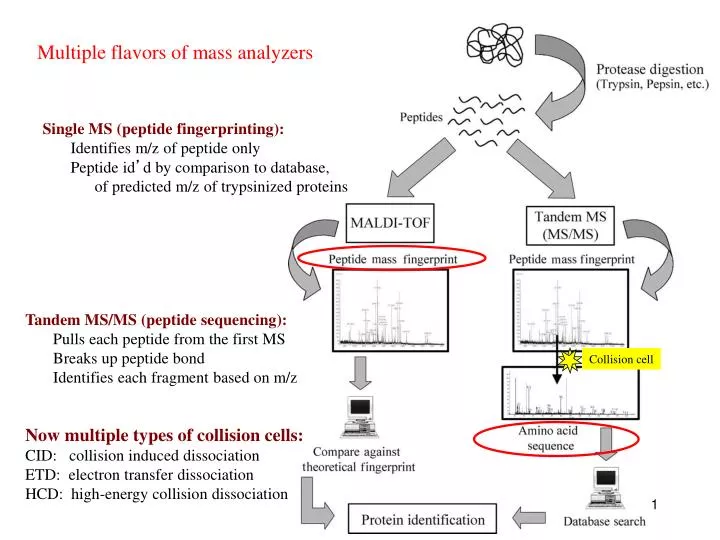
Multiple flavors of mass analyzers. Single MS (peptide fingerprinting): Identifies m/z of peptide only Peptide id ’ d by comparison to database, of predicted m/z of trypsinized proteins. Tandem MS/MS (peptide sequencing): Pulls each peptide from the first MS

E N D
Multiple flavors of mass analyzers Single MS (peptide fingerprinting): Identifies m/z of peptide only Peptide id’d by comparison to database, of predicted m/z of trypsinized proteins Tandem MS/MS (peptide sequencing): Pulls each peptide from the first MS Breaks up peptide bond Identifies each fragment based on m/z Collision cell Now multiple types of collision cells:CID: collision induced dissociation ETD: electron transfer dissociation HCD: high-energy collision dissociation
Intro to Mass Spec (MS) Separate and identify peptide fragments by their Mass and Charge (m/z ratio) Mass Spec MS Spectrum Ion source Mass analyzer Detector Basic principles: 1. Ionize (i.e. charge) peptide fragments 2. Separate ions by mass/charge (m/z) ratio 3. Detect ions of different m/z ratio 4. Compare to database of predicted m/z fragments for each genome
How does each spectrum translate to amino acid sequence? Mann Nat Reviews MBC. 5:699:711
How does each spectrum translate to amino acid sequence? • De novo sequencing: very difficult and not widely used (but being developed) • for large-scale datasets • Matching observed spectra to a database of theoretical spectra • Matching observed spectra to a spectral database of previously seen spectra
Nesvizhskii (2010) J. Proteomics, 73:2092-2123. • spectral matching is supposedly more accurate but … • limited to the number of peptides whose spectra have been observed before With either approach, observed spectra are processed to: group redundant spectra, remove bad spectra, recognized co-fragmentation, improve z estimates Many good spectra will not match a known sequence due to: absence of a target in DB, PTM modifies spectrum, constrained DB search, incorrect m or z estimate.
Result: peptide-to-spectral match (PSM) A major problem in proteomics is bad PSM calls … therefore statistical measures are critical Methods of estimating significance of PSMs: p- (or E-) value: compare score S of best PSM against distribution of all S for all spectra to all theoretical peptides • FDR correction methods: • B&H FDR • Estimate the null distribution of RANDOM PSMs: • - match all spectra to real (‘target’) DB and to fake (‘decoy) DB • - often decoy DB is the same peptides in the library but reverse sequence • one measure of FDR: 2*(# decoy hits) / (# decoy hits + # target hits) 3. Use #2 above to calculate posterior probabilities for EACH PSM
3. Use #2 above to calculate posterior probabilities for EACH PSM • - mixture model approach: take the distribution of ALL scores S • - this is a mixture of ‘correct’ PSMs and ‘incorrect’ PSMs • - but we don’t know which are correct or incorrect • - scores from decoy comparison are included, which can provide • some idea of the distribution of ‘incorrect’ scores • EM or Bayesian approaches can then estimate the proportion of correct vs. • incorrect PSM … based on each PSM score, a posterior probability is calculated FDR can be done at the level of PSM identification … but often done at the level of Protein identification
Error in PSM identification can amplify FDR in Protein identification Some methods combine PSM FDR to get a protein FDR Nesvizhskii (2010) J. Proteomics, 73:2092-2123. Often focus on proteins identified by at least 2 different PSMs (or proteins with single PSMs of very high posterior probability)
Some practical guidelines for analyzing proteomics results • Know that abundant proteins are much easier to identify • # of peptides per protein is an important consideration • - proteins ID’d with >1 peptide are more reliable • - proteins ID’d with 1 peptide observed repeatedly are more reliable • - note than longer proteins are more likely to have false PSMs • Think carefully about the p-value/FDR and know how it was calculated • Know that proteomics is no where near saturating • … many proteins will be missed
Quantitative proteomics Either absolute measurements or relatively comparisons • Spectral counting • Isotope labeling (SILAC) • Isobaric tagging (iTRAQ & TMT) • SRM
Spectral counting counting the number of peptides and counts for each protein Challenges: - different peptides are more (or less) likely to be assayed - analysis of complex mixtures often not saturating – may miss some peptides in some runs newer high-mass accuracy machines alleviate these challenges - quantitation comes in comparing separate mass-spec runs … therefore normalization is critical and can be confounded by error - requires careful statistics to account for differences in: quality of run, likelihood of observing each peptide, likelihood of observing each protein (eg. based on length, solubility, etc) Advantages / Challenges + label-free quantitation; cells can be grown in any medium - requires careful statistics to quantify - subject to run-to-run variation / error
SILAC (Stable Isotope Labeling with Amino acids in Cell culture) Cells are grown separately in heavy (13C) or light (12C) amino acids (often K or R), lysates are mixed, then analyzed in the same mass-spec run Mass shift of one neutron allows deconvolution, and quantification, of peaks in the same run. Advantages / Challenges: + not affected by run-to-run variation - need special media to incorporate heavy aa’s, - can only compare (and quantify) 2 samples directly - incomplete label incorporation can confound MS/MS identification
Isobaric Tagging iTRAQ or Tandem Mass Tags, TMTs Each peptide mix covalently tagged with one of 4, 6, or 8 chemical tags of identical mass Samples are then pooled and analyzed in the same MS run Collision before MS2 breaks tags – Tags can be distinguished in the small-mass range and quantified to give relative abundance across up to 8 samples. LTQ Velos Orbitrap Advantages / Challenges: + can analyze up to 8 samples, same run - still need to deal with normalization
Selective Reaction Monitoring (SRM) Targeted proteomics to quantify specific peptides with great accuracy • Specialized instrument capable of very sensitively measuring • the transition of precursor peptide and one peptide fragment • Typically dope in heavy-labeled synthetic peptides of precisely known • abundance to quantify Advantages: - best precision measurements Disadvantages: - need to identify ‘proteotypic’ peptides for doping controls - expensive to make many heavy peptides of precise abundance - limited number of proteins that can be analyzed
Phospho-proteomics and Post-translational modifications (PTMs) phosphorylated (P’d) peptides are enriched, typically through chromatography - P’d peptides do not ionize as well as unP’d peptides - enrichment of P’d peptides ensures ionization and aids in mapping IMAC: immobilized metal ion affinity chromatography - phospho groups bind charged metals - contamination by negatively-charged peptides Titanium dioxide (TiO2) column: - binds phospho groups (mono-P’d better than multi-P’d) SIMAC: Sequential Elution from IMAC: - IMAC followed by TiO2 column Goal: identify which residues are phosphorylated (Ser, Thr, Tyr), mapped based on known m/z of phospho group