Download
1 / 1
10 likes | 153 Views
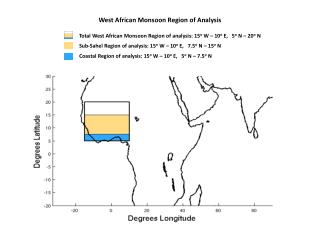
Half-precessional dynamics of monsoon rainfall near the East African equator. AGU2008f PP41B-1450. -9. -8. -7. -6. -5. -4.

E N D
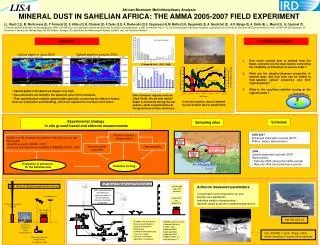
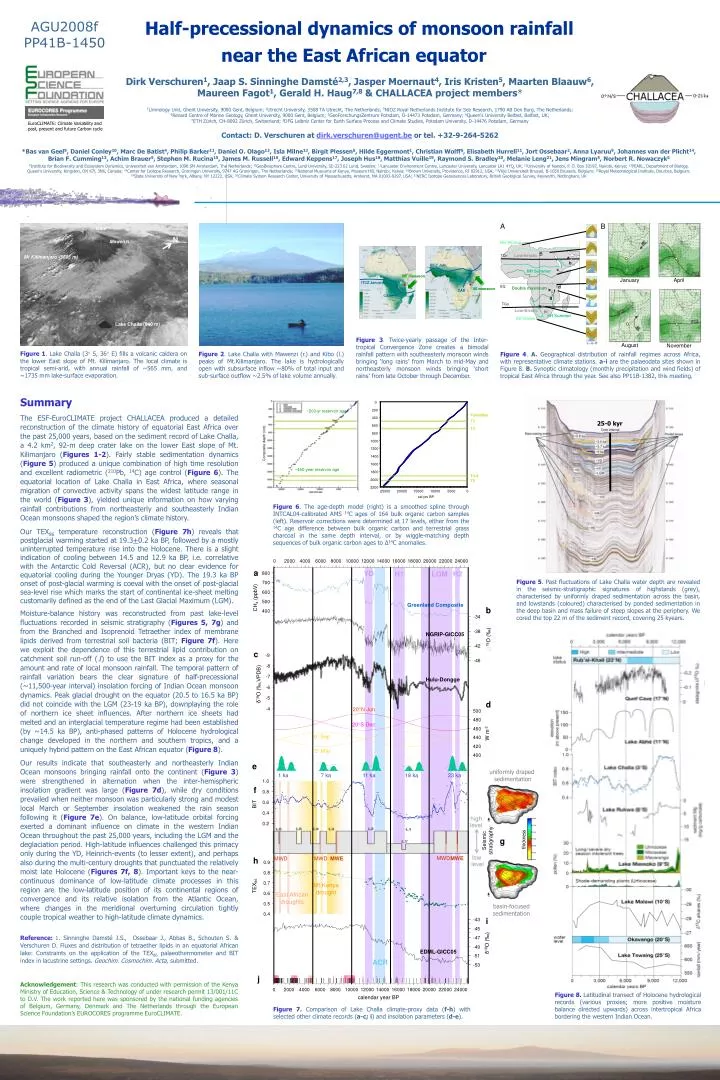
Half-precessional dynamics of monsoon rainfall near the East African equator AGU2008fPP41B-1450 -9 -8 -7 -6 -5 -4 Dirk Verschuren1, Jaap S. Sinninghe Damsté2,3, Jasper Moernaut4, Iris Kristen5, Maarten Blaauw6, Maureen Fagot1, Gerald H. Haug7,8 & CHALLACEA project members* 1Limnology Unit, Ghent University, 9000 Gent, Belgium; 2Utrecht University, 3508 TA Utrecht, The Netherlands; 3NIOZ Royal Netherlands Institute for Sea Research, 1790 AB Den Burg, The Netherlands; 4Renard Centre of Marine Geology, Ghent University, 9000 Gent, Belgium; 5GeoForschungsZentrum Potsdam, D-14473 Potsdam, Germany; 6Queen's University Belfast, Belfast, UK; 7ETH Zürich, CH-8092 Zürich, Switzerland; 8DFG Leibniz Center for Earth Surface Process and Climate Studies, Potsdam University, D-14476 Potsdam, Germany Contact: D. Verschuren at dirk.verschuren@ugent.be or tel. +32-9-264-5262 500 480 460 EuroCLIMATE: Climate Variability and past, present and future Carbon cycle 440 420 400 0.9 *Bas van Geel9, Daniel Conley10, Marc De Batist4, Philip Barker11, Daniel O. Olago12, Isla Milne13, Birgit Plessen5, Hilde Eggermont1, Christian Wolff5, Elisabeth Hurrell11, Jort Ossebaar2, Anna Lyaruu9, Johannes van der Plicht14, Brian F. Cumming13, Achim Brauer5, Stephen M. Rucina15, James M. Russell16, Edward Keppens17, Joseph Hus18, Matthias Vuille19, Raymond S. Bradley20, Melanie Leng21, Jens Mingram5, Norbert R. Nowaczyk5 9Institute for Biodiversity and Ecosystem Dynamics, Universiteit van Amsterdam, 1098 SM Amsterdam, The Netherlands; 10GeoBiosphere Centre, Lund University, SE-223 62 Lund, Sweden; 11Lancaster Environment Centre, Lancaster University, Lancaster LA1 4YQ, UK; 12University of Nairobi, P. O. Box 30197, Nairobi, Kenya; 13PEARL, Department of Biology, Queen's University, Kingston, ON K7L 3N6, Canada; 14Center for Isotope Research, Groningen University, 9747 AG Groningen, The Netherlands; 15National Museums of Kenya, Museum Hill, Nairobi, Kenya; 16Brown University, Providence, RI 02912, USA; 17Vrije Universiteit Brussel, B-1050 Brussels, Belgium; 18Royal Meteorological Institute, Dourbes, Belgium; 19State University of New York, Albany, NY 12222, USA; 20Climate System Research Center, University of Massachusetts, Amherst, MA 01003-9297, USA; 21NERC Isotope Geosciences Laboratory, British Geological Survey, Keyworth, Nottingham, UK 0.8 0.7 0.6 0.5 0.4 0 2000 4000 6000 8000 10000 12000 14000 16000 18000 20000 22000 24000 A B NH Winter B Low-Erratic TCn a b ITCZ July c NH Summer NE monsoon April January ITCZ January EQ d Double maximum SE monsoon e CAB f CAB g TCp h Low-Erratic i SH Summer SH Winter Figure 3. Twice-yearly passage of the Inter-tropical Convergence Zone creates a bimodal rainfall pattern with southeasterly monsoon winds bringing ‘long rains’ from March to mid-May and northeasterly monsoon winds bringing ‘short rains’ from late October through December. August November J--JJ--D Figure 4. A. Geographical distribution of rainfall regimes across Africa, with representative climate stations. a-i are the palaeodata sites shown in Figure 8. B. Synoptic climatology (monthly precipitation and wind fields) of tropical East Africa through the year. See also PP11B-1382, this meeting. Figure 1. Lake Challa (3° S, 36° E) fills a volcanic caldera on the lower East slope of Mt. Kilimanjaro. The local climate is tropical semi-arid, with annual rainfall of ~565 mm, and ~1735 mm lake-surface evaporation. Figure 2. Lake Challa with Mawenzi (r.) and Kibo (l.) peaks of Mt.Kilimanjaro. The lake is hydrologically open with subsurface inflow ~80% of total input and sub-surface outflow ~2.5% of lake volume annually. Kibo N Mawenzi Mt.Kilimanjaro (5895 m) Summary The ESF-EuroCLIMATE project CHALLACEA produced a detailed reconstruction of the climate history of equatorial East Africa over the past 25,000 years, based on the sediment record of Lake Challa, a 4.2 km2, 92-m deep crater lake on the lower East slope of Mt. Kilimanjaro (Figures 1-2). Fairly stable sedimentation dynamics (Figure 5) produced a unique combination of high time resolution and excellent radiometric (210Pb, 14C) age control (Figure 6). The equatorial location of Lake Challa in East Africa, where seasonal migration of convective activity spans the widest latitude range in the world (Figure 3), yielded unique information on how varying rainfall contributions from northeasterly and southeasterly Indian Ocean monsoons shaped the region’s climate history. Our TEX86 temperature reconstruction (Figure 7h) reveals that postglacial warming started at 19.3+0.2 ka BP, followed by a mostly uninterrupted temperature rise into the Holocene. There is a slight indication of cooling between 14.5 and 12.9 ka BP, i.e. correlative with the Antarctic Cold Reversal (ACR), but no clear evidence for equatorial cooling during the Younger Dryas (YD). The 19.3 ka BP onset of post-glacial warming is coeval with the onset of post-glacial sea-level rise which marks the start of continental ice-sheet melting customarily defined as the end of the Last Glacial Maximum (LGM). Moisture-balance history was reconstructed from past lake-level fluctuations recorded in seismic stratigraphy (Figures 5, 7g) and from the Branched and Isoprenoid Tetraether index of membrane lipids derived from terrestrial soil bacteria (BIT; Figure 7f).Here we exploit the dependence of this terrestrial lipid contribution on catchment soil run-off (1) to use the BIT index as a proxy for the amount and rate of local monsoon rainfall. The temporal pattern of rainfall variation bears the clear signature of half-precessional (~11,500-year interval) insolation forcing of Indian Ocean monsoon dynamics. Peak glacial drought on the equator (20.5 to 16.5 ka BP) did not coincide with the LGM (23-19 ka BP), downplaying the role of northern ice sheet influences. After northern ice sheets had melted and an interglacial temperature regime had been established (by ~14.5 ka BP), anti-phased patterns of Holocene hydrological change developed in the northern and southern tropics, and a uniquely hybrid pattern on the East African equator (Figure 8). Our results indicate that southeasterly and northeasterly Indian Ocean monsoons bringing rainfall onto the continent (Figure 3) were strengthened in alternation when the inter-hemispheric insolation gradient was large (Figure 7d), while dry conditions prevailed when neither monsoon was particularly strong and modest local March or September insolation weakened the rain season following it (Figure 7e). On balance, low-latitude orbital forcing exerted a dominant influence on climate in the western Indian Ocean throughout the past 25,000 years, including the LGM and the deglaciation period. High-latitude influences challenged this primacy only during the YD, Heinrich-events (to lesser extent), and perhaps also during the multi-century droughts that punctuated the relatively moist late Holocene (Figures 7f, 8). Important keys to the near-continuous dominance of low-latitude climate processes in this region are the low-latitude position of its continental regions of convergence and its relative isolation from the Atlantic Ocean, where changes in the meridional overturning circulation tightly couple tropical weather to high-latitude climate dynamics. Reference:1. Sinninghe Damsté J.S., Ossebaar J., Abbas B., Schouten S. & Verschuren D. Fluxes and distribution of tetraether lipids in an equatorial African lake: Constraints on the application of the TEX86 palaeothermometer and BIT index in lacustrine settings. Geochim. Cosmochim. Acta, submitted. 0 ~200-yr reservoir age 200 Turbidites 400 25-0 kyr T1 600 T2 800 Lake Challa (840 m) 1000 Composite depth (cm) 1200 1400 1600 ~450-year reservoir age 1800 T3-4 T5 2000 2200 25000 20000 15000 10000 5000 0 Figure 6. The age-depth model (right) is a smoothed spline through INTCAL04-calibrated AMS 14C ages of 164 bulk organic carbon samples (left). Reservoir corrections were determined at 17 levels, either from the 14C age difference between bulk organic carbon and terrestrial grass charcoal in the same depth interval, or by wiggle-matching depth sequences of bulk organic carbon ages to Δ14C anomalies. cal yrs BP Figure 5. Past fluctuations of Lake Challa water depth are revealed in the seismic-stratigraphic signatures of highstands (grey), characterised by uniformly draped sedimentation across the basin, and lowstands (coloured) characterised by ponded sedimentation in the deep basin and mass failure of steep slopes at the periphery. We cored the top 22 m of the sediment record, covering 25 kyears. a YD H2 H1 LGM 800 700 600 CH4 (ppbV) 500 Greenland Composite b 400 -34 -38 NGRIP-GICC05 18O (‰) -42 c -46 Hulu-Dongge δ18O (‰,VPDB) d 20°N Jun 20°S Dec W m-2 0° Sep 0° Mar e uniformly draped sedimentation 1 ka 7 ka 11 ka 18 ka 23 ka 1.0 f 0.8 0.6 BIT 0.4 high level 0.2 thickness Seismicstratigraphy g low level h MWD MWE MWD MWD MWE Mt.Kenyadrought TEX86 East Africandroughts basin-focusedsedimentation i -43 -45 -47 δ18O (‰) -49 EDML-GICC05 -51 ACR -53 Acknowledgement: This research was conducted with permission of the Kenya Ministry of Education, Science & Technology of under research permit 13/001/11C to D.V.The work reported here was sponsored by the national funding agencies of Belgium, Germany, Denmark and The Netherlands through the European Science Foundation’s EUROCORES programme EuroCLIMATE. Figure 8. Latitudinal transect of Holocene hydrological records (various proxies; more positive moisture balance directed upwards) across intertropical Africa bordering the western Indian Ocean. j 0 2000 4000 6000 8000 10000 12000 14000 16000 18000 20000 22000 24000 calendar year BP Figure 7. Comparison of Lake Challa climate-proxy data (f-h) with selected other climate records (a-c; i) and insolation parameters (d-e).