Download
1 / 24
700 likes | 1.62k Views
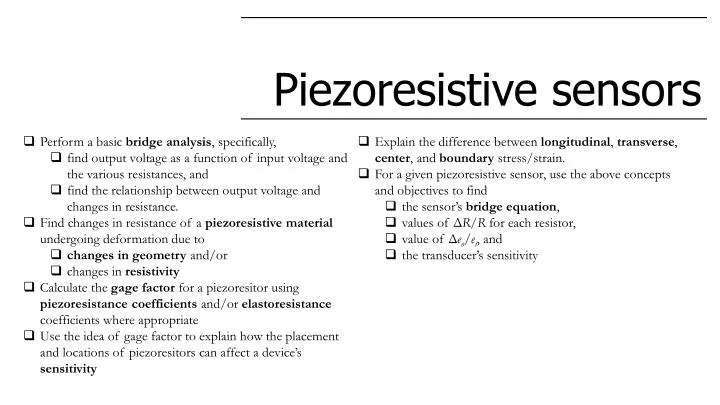
Piezoresistive sensors. Perform a basic bridge analysis , specifically, find output voltage as a function of input voltage and the various resistances, and find the relationship between output voltage and changes in resistance.

E N D
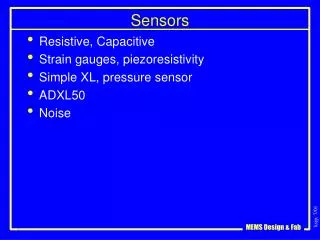
Piezoresistive sensors • Perform a basic bridge analysis, specifically, • find output voltage as a function of input voltage and the various resistances, and • find the relationship between output voltage and changes in resistance. • Find changes in resistance of a piezoresistivematerial undergoing deformation due to • changes in geometry and/or • changes in resistivity • Calculate the gage factor for a piezoresitorusing piezoresistance coefficients and/or elastoresistance coefficients where appropriate • Use the idea of gage factor to explain how the placement and locations of piezoresitors can affect a device’s sensitivity • Explain the difference between longitudinal, transverse, center, and boundary stress/strain. • For a given piezoresistive sensor, use the above concepts and objectives to find • the sensor’s bridge equation, • values of ΔR/Rfor each resistor, • value of Δeo/ei, and • the transducer’s sensitivity
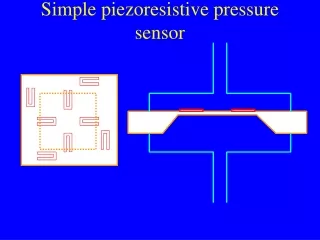
Piezoresistance Circuit with measurable output voltage proportional to the electrical resistance Electrical resistance changes with mechanical deformation (strain) constant DC voltage input to bridge piezoresitive sensor mechanical input resistance output voltage output
Wheatstone bridge analysis • Tetoca a ti Find the relationship between the input and output voltages for the bridge shown. Assume imis zero. Find the relationship between R1, R2, R3, and R4for eo = 0. We would like this output to be zero when there is no mechanical input to the transducer.
Bridge balancing Full bridge: Half bridge: All four resistors identical piezoresistors with same value of R, o sea, R1 = R2= R3= R4 R1 and R2identical piezoresistors with R3 and R4identical fixed resistors or vice versa What is the relation between a changein resistance ΔR and the output voltage eo?
Gage factors and the piezoresistive effect What is the relation between deformation and resistance? Gage factor: Metals Changes in geometry dominate Semiconductors Changes in resistivity dominate * * Strain causes differences in atomic spacing, which in turn causes changes in band gaps and thus ρ.
Gage factors for strain gages Piezoresistors made of metals are usually used in strain gages responding to uniaxial strain. • Tetoca a ti Find the gage factor for a strain gage subject to uniaxial strain applied to an isotropic material. (Hint: you can neglect products of length changes; i.e., ΔhΔw ≈ 0.)
Gage factors for semiconductors Stress formulation: Recall that in semiconductors changes in resistivity dominate resistance changes upon deformation. • πLandπTand are the piezoresistance coefficients • L – longitudinal: • T – transverse: in the direction of current perpendicular to the direction of current Strain formulation: γLandγ Tand are the elastoresistance coefficients
Gage factors for semiconductors • Tetoca a ti Find the gage factor for a typical semiconductor device. Use the elastoresistance coefficients in your formulation. (Hints: Recall that in semiconductors changes in resistivity dominate resistance changes upon deformation. How will you model the stress/strain?) Gage factor: Most likely not isotropic
Gage factor as figure of merit • Gage factor is a figure of merit that • helps us decide which material to use for a piezoresistor • helps us decide where to put the piezoresistors
Physical placement and orientation of piezoresistors 2 1 4 3 ≠ 0 = 0 !
Physical placement and orientation of piezoresistors The sensitivity will decrease.
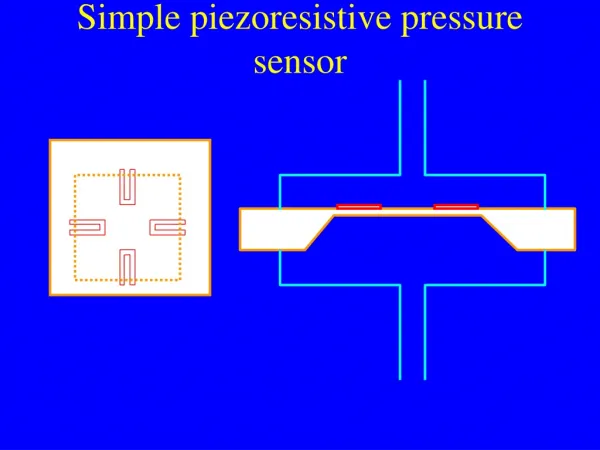
Schematics of the sensor Piezoresistors detect stress and strain of the wafer using a bridge configuration. Electrical output signal is proportional to the inlet pressure.
Designing for a given sensitivity We would like to design a pressure sensor with a 0–1 MPa (145 psi) span, 0–100 mV full scale output, a 10 VDC excitation, and p-Si piezoresistors. What is the sensitivity? η = FSO/Span = (100 – 0) mV/(1 – 0) MPa = 100 mV/MPa How do we design the senor to achieve this sensitivity?
Location of piezoresistors Where should we place the piezoresistors on the diaphragm? σC– σB– towards the center along the boundary Typical values at max deflection: σC= 45.0 MPa, σB= 22.5 MPa εC= 152 × 10-6, εB= -17 × 10-6 i i i i
Designing for a given sensitivity Next, let’s find the change in output voltage corresponding to resistors in these locations. σC σB = γLεC+ γTεB = (120)(152×10-6)+ (-54)(-17×10-6) = 19.1×10⁻³ Typical values of stress, strain, and elastoresistance coefficients: σC = 45.0 MPa, σB = 22.5 MPaγL= 120 <110> εC= 152 × 10-6, εB = -17 × 10-6 γT= -54 <110>
Designing for a given sensitivity • Tetoca a ti Find the values of ΔR2/R and ΔR4/R using the same assumed values of stress, strain, and elastoresistance. σC = γLεB + γTεC = (120)(-17×10-6)+ (-54)(152×10-6) = -10.2×10⁻³ σB Typical values of stress, strain, and elastoresistance coefficients: σC = 45.0 MPa, σB = 22.5 MPaγL= 120 <110> εC= 152 × 10-6, εB = -17 × 10-6 γT= -54 <110>
Designing for a given sensitivity • Requirements: • 0–1 MPa (145 psi) span • 0–100 mV full scale output • 10 VDC excitation • η= 100 mV/MPa η = FSO/Span = (147 – 0) mV/(1 – 0) MPa = 147 mV/MPa Need to attenuate the signal. With ei = 10 V
Attenuation of output inverting amplifier KIA = -Rf/R0 The gain is K = 100 mV/147 mV = 0.682 K = (KIA) (KIA) = (-Rf/R0)(-Rf/R0) = (Rf/R0)2
Tetoca a ti Select two resistors (esdecir,Rf y R0) from the available resistors below to achieve K = (Rf/R0)2= 0.682. • Readily-obtained resistors for use in an op-amp circuit (Ohms) R0 Rf With Rf= 7.2 Ω and R0= 6.2 Ω K= 0.683
Attenuation of output The amplifier goes into the signal conditioning compartment of the transducer
Tetoca a ti A configuration of p-Si resistors on a square diaphragm is suggested in which two resistors in series are used to sense the maximum stress, σC, as shown in the figure. Find the new bridge equation (i.e., eo in terms of ei and the various resistances), ΔR/Rfor each resistor, Δeo/ei, and the transducer sensitivity (with no amplifier circuit) Assume the same dimensions, sensor requirements, materials, and stress/strain values as in the case study. 1b second resistor in series 1a 3a 3b