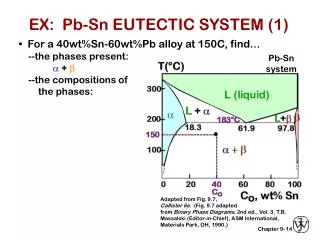
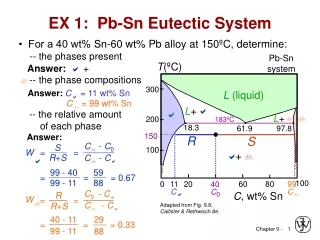
Download
1 / 1
10 likes | 160 Views
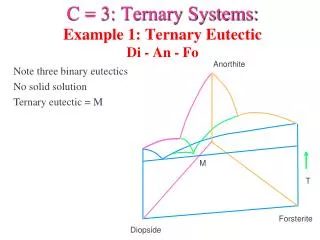
a. b. Matrix phase (b -Sn). 40 m. 40 m. 40 m. Rod phase (Ag 3 Sn). 40 m. d. c. Fig. 2. Variation of HV, as a function of V for Sn-Ag-Zn e.utectic alloy at a constant G. Fig. 4. Temperature dependence of r for Sn, Zn, Ag and Sn-Ag-Zn eutectic alloy.

E N D
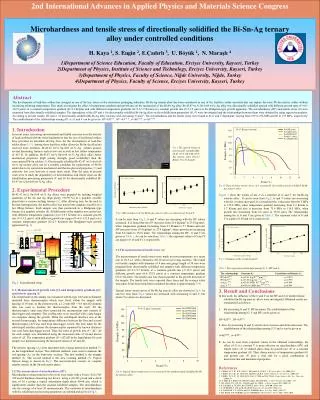
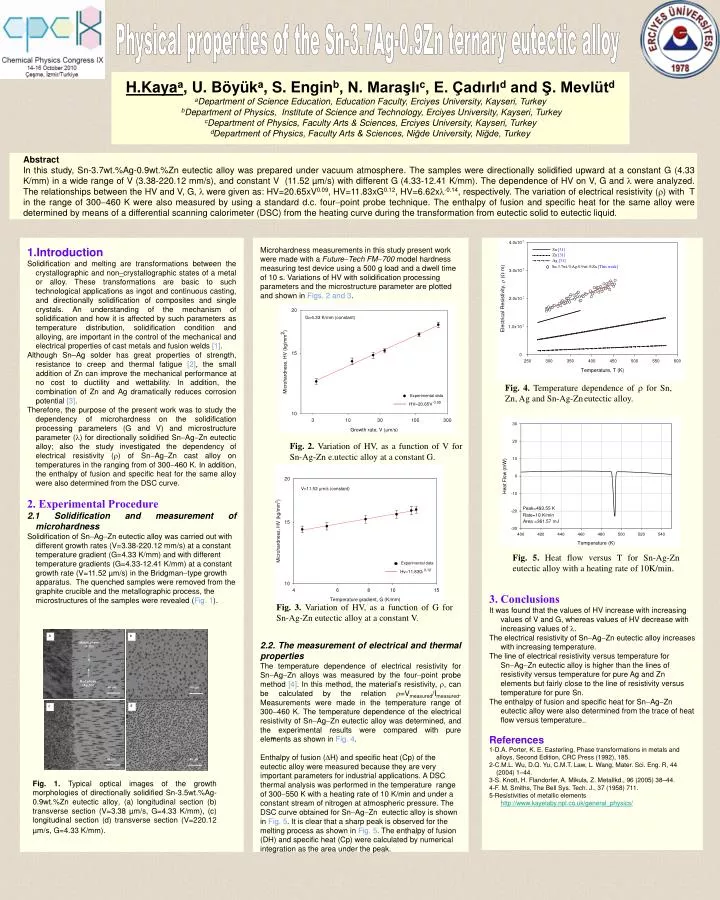
a b Matrix phase (b-Sn) 40 m 40 m 40 m Rod phase (Ag3Sn) 40 m d c • Fig. 2.Variation of HV, as a function of V for Sn-Ag-Zn e.utectic alloy at a constant G. • Fig. 4. Temperature dependence of r for Sn, Zn, Ag and Sn-Ag-Zneutectic alloy. • Fig. 3.Variation of HV, as a function of Gfor Sn-Ag-Zn eutectic alloy at a constant V. • Fig. 5. Heat flow versus T for Sn-Ag-Zn eutectic alloy with a heating rate of 10K/min. Physical properties of the Sn-3.7Ag-0.9Zn ternary eutectic alloy H.Kayaa, U. Böyüka, S. Enginb, N. Maraşlıc, E. Çadırlıd and Ş. MevlütdaDepartment of Science Education, Education Faculty, Erciyes University, Kayseri, TurkeybDepartment of Physics, Institute of Science and Technology, Erciyes University, Kayseri, Turkey cDepartment of Physics, Faculty Arts & Sciences, Erciyes University, Kayseri, Turkey dDepartment of Physics, Faculty Arts & Sciences, Niğde University, Niğde, Turkey • Abstract • In this study, Sn-3.7wt.%Ag-0.9wt.%Zn eutectic alloy was prepared under vacuum atmosphere. The samples were directionally solidified upward at a constant G (4.33 K/mm) in a wide range of V (3.38-220.12 mm/s), and constant V (11.52 µm/s) with different G (4.33-12.41 K/mm). The dependence of HV on V, G and were analyzed. The relationships between the HV and V, G, l were given as: HV=20.65xV0.09, HV=11.83xG0.12, HV=6.62xl-0.14, respectively. The variation of electrical resistivity () with T in the range of 300460 K were also measured by using a standard d.c. fourpoint probe technique. The enthalpy of fusion and specific heat for the same alloy were determined by means of a differential scanning calorimeter (DSC) from the heating curve during the transformation from eutectic solid to eutectic liquid. 1.Introduction Solidification and melting are transformations between the crystallographic and noncrystallographic states of a metal or alloy. These transformations are basic to such technological applications as ingot and continuous casting, and directionally solidification of composites and single crystals. An understanding of the mechanism of solidification and how it is affected by such parameters as temperature distribution, solidification condition and alloying, are important in the control of the mechanical and electrical properties of cast metals and fusion welds [1]. Although Sn–Ag solder has great properties of strength, resistance to creep and thermal fatigue [2], the small addition of Zn can improve the mechanical performance at no cost to ductility and wettability. In addition, the combination of Zn and Ag dramatically reduces corrosion potential [3]. Therefore, the purpose of the present work was to study the dependency of microhardness on the solidification processing parameters (G and V) and microstructure parameter () for directionally solidified SnAgZn eutectic alloy; also the study investigated the dependency of electrical resistivity () of SnAgZn cast alloy on temperatures in the ranging from of 300460 K. In addition, the enthalpy of fusion and specific heat for the same alloy were also determined from the DSC curve. 2. Experimental Procedure 2.1 Solidification and measurement of microhardness Solidification of SnAgZn eutectic alloy was carried out with different growth rates (V=3.38-220.12 mm/s) at a constant temperature gradient (G=4.33 K/mm) and with different temperature gradients (G=4.33-12.41 K/mm) at a constant growth rate (V=11.52 µm/s) in the Bridgmantype growth apparatus. The quenched samples were removed from the graphite crucible and the metallographic process, the microstructures of the samples were revealed (Fig. 1). 3. Conclusions It was found that the values of HV increase with increasing values of V and G, whereas values of HV decrease with increasing values of . The electrical resistivity of SnAgZn eutectic alloy increases with increasing temperature. The line of electrical resistivity versus temperature for SnAgZn eutectic alloy is higher than the lines of resistivity versus temperature for pure Ag and Zn elements but fairly close to the line of resistivity versus temperature for pure Sn. The enthalpy of fusion and specific heat for SnAgZn eutectic alloy were also determined from the trace of heat flow versus temperature.. References 1-D.A. Porter, K. E. Easterling, Phase transformations in metals and alloys, Second Edition, CRC Press (1992), 185. 2-C.M.L. Wu, D.Q. Yu, C.M.T. Law, L. Wang, Mater. Sci. Eng. R, 44 (2004) 1–44. 3-S. Knott, H. Flandorfer, A. Mikula, Z. Metallkd., 96 (2005) 38–44. 4-F. M. Smiths, The Bell Sys. Tech. J., 37 (1958) 711. 5-Resistivities of metallic elements http://www.kayelaby.npl.co.uk/general_physics/ Microhardness measurements in this study present work were made with a FutureTech FM700 model hardness measuring test device using a 500 g load and a dwell time of 10 s. Variations of HV with solidification processing parameters and the microstructure parameter are plotted and shown in Figs. 2 and 3. 2.2. The measurement of electrical and thermal properties The temperature dependence of electrical resistivity for SnAgZn alloys was measured by the fourpoint probe method [4]. In this method, the material’s resistivity, r, can be calculated by the relation r=Vmeasured/Imeasured. Measurements were made in the temperature range of 300460 K. The temperature dependence of the electrical resistivity of SnAgZn eutectic alloy was determined, and the experimental results were compared with pure elements as shown in Fig. 4. Enthalpy of fusion (DH) and specific heat (Cp) of the eutectic alloy were measured becausetheyare veryimportant parameters for industrialapplications. A DSC thermal analysis was performed in the temperature range of 300550 K with a heatingrate of 10 K/min and under a constant stream ofnitrogen at atmosphericpressure. The DSC curveobtained for SnAgZn eutectic alloy is shown inFig. 5. It is clear that a sharppeak is observed forthe melting process as shown inFig. 5. Theenthalpy of fusion (DH) and specific heat(Cp) werecalculated by numerical integration as theareaunder the peak. (a) Fig. 1. Typical optical images of the growth morphologies of directionally solidified Sn-3.5wt.%Ag-0.9wt.%Zneutectic alloy, (a) longitudinal section (b) transverse section (V=3.38 µm/s, G=4.33 K/mm), (c) longitudinal section (d) transverse section (V=220.12 µm/s, G=4.33 K/mm).