Download
1 / 32
320 likes | 443 Views
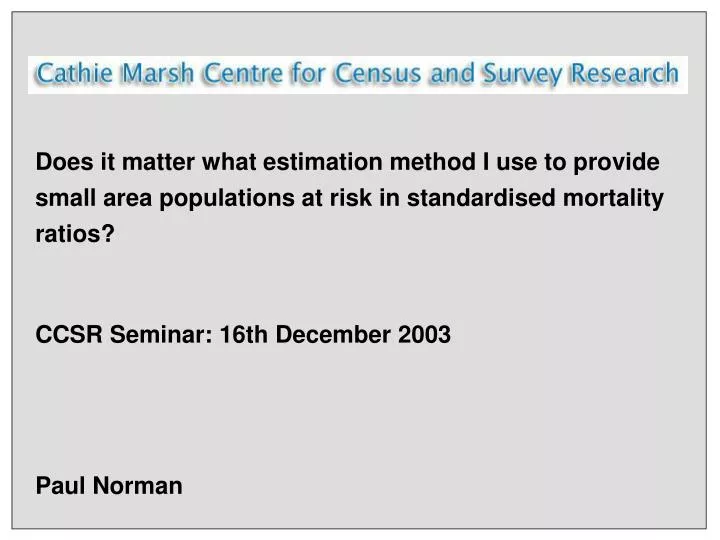
Does it matter what estimation method I use to provide small area populations at risk in standardised mortality ratios? CCSR Seminar: 16th December 2003 Paul Norman. Context Rates of health may need to be calculated for small geographical areas

E N D
Does it matter what estimation method I use to provide small area populations at risk in standardised mortality ratios? CCSR Seminar: 16th December 2003 Paul Norman
Context • Rates of health may need to be calculated for small geographical areas • Census years we have age-sex population counts for a range of geographical areas, but outside census years … • Annual age-sex disaggregated mid-year estimates only available down to local authority level • Various small area population estimation methods commonly used • Studies have shown variation in population sizes & age structures • Lunn et al. (1998) • Middleton (1996) • Simpson et al. (1996 and 1997) • Rees (1994) • Differently estimated small area ‘populations at risk’ may lead to different SMRs if different size &/or age-sex structure
Deaths in a standard area population Population in the standard area Population in the location of interest X Indirect Standardised Mortality Ratio (SMR) SMR = Observed mortality events Expected mortality events SMR = 100 x Deaths in a location of interest Observed Expected
Deaths in a standard area population Population in the standard area Population in the location of interest X Data sources for indirect SMRs at ward level SMR = 100 x Deaths in a location of interest Mortality data at national level Mortality data for the ward (VS4) By matching age-sex information Population estimate at national level Population estimate for the ward
This work … • Estimate a time-series of ward populations using various methods • Use outputs in SMRs • Address denominator uncertainties • Research definitions • Small area: electoral wards (caveat) • Mortality measure: indirect SMRs (caveat) • Time period: annual mid-year estimates 1990-1998 • Geography: 1998 wards in GOR East • Output detail: age-groups (11) and sex (2) • Data acquisition: nationally consistent, public domain sources • Base population: Estimating with Confidence Populations (EwCPOP) based on 1991 Census (caveat)
Steps to achieve this … • Input data preparation • Geographical harmonisation • Temporal harmonisation • Single year of age • Estimation methods • Indicator of sub-district, ward level change (electorate) • Cohort-component • Optional enhancements • Allowances for special sub-populations • Hybrid methods • Constraints • Standardised mortality ratios • Use ward age-sex estimates as populations at risk • 2001 Census implications?
Postcode locations as building-bricks: assumptions • Residential postcode distribution is a proxy for population distribution (enhanced by household or address counts) • At a point in time a set of postcodes constitutes a ward Haldens & Panshanger 1998 Haldens 1991
Temporal harmonisation Population estimates needed for the mid-year Census ONS mid-year estimates Electorate Vital statistics
Disaggregation to single year of age • For annual ageing-on • For aggregation into appropriate age-groups
Estimation methods data scheme Ward totals Males Females Data at time t Wards (within LA district) Age 0-90+ Age 0-90+ LA district totals Data at time t + 1 ? ?
Indicators of change • ONS MYEs • Annual mid-year time-series available • Age-sex detail, but • Only district level • Electorates as sub-district indicator • Annual time-series available, but • Collected 10th October • Only adult ages • Variable enumeration space & time
Apportionment, additive & ratio methods Data at time t Electorate derived ward totals Change between t & t + 1 ONS district MYEs Data at time t + 1 Electorate derived ward totals Apply previous age structure &/or constrain to MYE ONS district MYEs
Births Deaths In-migration Out-migration Ageing-on + - + - Cohort-component method (includes Vital Statistics) Data at time t Data at time t + 1 Electorate derived ward totals ONS district MYEs
Cohort-component enhancement: Suppressed aging-on of special populations • Students • Armed forces • Communal establishments
Method option: Constraints • Ward age-sex estimates are controlled to sum to district-level age-sex information, ONS annual MYE • Larger area estimates tend to be more reliable • Ensures consistency with ONS published data & thus … • More acceptable, but … • Some LAs disagree with the ONS MYE
Ages 0 90+ 0 90+ Constraints and Iterative Proportional Fitting (IPF) Ward (row) totals 1 Males Females Wards in LA district t + 1 initial age-sex estimates n Ward constraints Age-group (column) totals Age-group district-level constraints
Many method / option combinations … Strategy for the choice of population at risk Differences in estimate outputs …
Differences in outputs (1991 cf 1998) Newnham: simpler methods constrained Coggeshall: simpler methods constrained Newnham: cohort-component, plus migration and special populations Coggeshall: cohort-component, plus migration and special populations
abs(1991 - 1998) 1991 Differences in outputs (1991 cf 1998) * 100 • Most variation in estimate outputs for: • Youngest ages • Young adults • Most elderly
Using 1998 outputs in SMR calculations (Newnham) Smaller base population leads to lower expected Student ages suppressed, elderly enhanced Similar structure to base, total & elderly enhanced Structure erroneously aged-on Students enhanced, elderly suppressed
Using 1998 outputs in SMR calculations (Newnham) Smaller base population leads to lower expected Student ages suppressed, elderly enhanced Similar structure to base, total & elderly enhanced Structure erroneously aged-on Students enhanced, elderly suppressed Lower expected leads to higher SMR Higher expected leads to lower SMR Youthful population leads to lower expected & higher SMR
Are the differences enough to make a difference?!? • Overlapping SMR confidence intervals? • Yes, but observations small numbers leading to wide CIs • Do wards fall in the same SMR quintile? • Ranking by SMR: • Quintile 1: 29% wards consistently most healthy • Quintile 5: 6% wards least healthy
Differently estimated populations at risk and SMRs … • If a larger population is estimated by a method compared with another, but with the same age-sex structure, a lower SMR results because more events are expected (and vice versa) • If a method estimates an older population structure than another, a higher expected is calculated, resulting in lower SMRs (and vice versa) • Population size is more critical in simpler methods (as little or no new age information) • Poorly specified cohort-component models tend to result in lower SMRs, because incorrectly aged-on populations lead to higher expected mortality • Fully specified cohort-component models tend to result in greater range of SMRs, due to populations kept youthful in certain locations by migration data and suppressed ageing of sub-groups (proxy for migration) • Areas with the best health consistently have lowest SMRs calculated • Areas with the very worst health similarly identified but not the same consistency • Fair level of tolerance in SMRs for all-ages • Not necessarily the case with age-specific mortality rates (Rees et al., 2003a)
Following 2001 Census outputs (& rebased MYEs) … • Uncertainty in the EwCPOP base population used • Uncertainty in the annual district level ONS MYEs used as constraints
In the light of the 2001 Census outputs … • Uncertainty in the annual national level ONS MYEs used for ASMRs National ASMRs differ Populations at risk differ Thus: Expected changes Events don’t change SMRs alter
Deaths in a standard area population Population in the standard area Population in the location of interest X Uncertainty in SMR calculations … SMR = 100 x Deaths in a location of interest Mortality data at national level Mortality data for the ward (VS4) Population estimate at national level Population estimate for the ward
Uncertainty in estimated populations at risk • By total size & by age • Newnham • Maximum • Average • Minimum • CC-mig-sp-IPF • Coggeshall • Maximum • Average • Minimum • CC-mig-sp-IPF No consideration here for rebasing MYEs!
Uncertainty in SMR calculations … How confident can we be in our SMR results? Confidence limits (c. 95%) are calculated using: The assumption is that the ‘expected’ is reliable But it is not! Event counts may well be more reliable!! (or Byar’s approximation)