Download
1 / 18
190 likes | 380 Views
Large Experimental Infrasound Array at Deelen, detection and signal analysis. Hein Haak and Läslo Evers haak@knmi.nl evers@knmi.nl http://www.knmi.nl/~evers. Measuring infrasound at KNMI. Distinguish between earthquakes and sonic sources (start of interest in 1985)

E N D
Large Experimental Infrasound Array at Deelen, detection and signal analysis Hein Haak and Läslo Evers haak@knmi.nl evers@knmi.nl http://www.knmi.nl/~evers
Measuring infrasound at KNMI • Distinguish between earthquakes and sonic sources (start of interest in 1985) • Research in the context of CTBT • Royal Airforce (Klu) driven research on sonic booms and chemical explosions • Couple seismology and atmospheric research • Provide public information on atmospheric events
KNMI Microbarometer • Broad band: 0.002 – 30 Hz, low inlet volume • Robust, low cost ($2000), almost off the shelf
Array detection and analysis • Infrasound has generally low signal-to-noise ratios and amplitudes are hard to predict efficient noise reducers signal stacking to enhance snr, state of the art detectors: Fisher, PMCC • Array processing for source characterization arrival time, apparent sound speed and back azimuth, other? (frequency content, wavelet scale, duration)
DIA: the Deelen Infrasound Array • 16 KNMI microbarometers • 1.5 km aperture • Porous hose noise reducer • Low cost test facility for infrasound
Array design criteria • Isotropic or omni-directional response circular shaped main lob • High resolution, minimal energy spreading delta-like main lob • Avoid spatial aliasing side lobs low amplitude and far from main lob Monochromatic response to 0.2 Hz plane wave
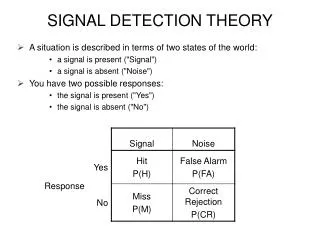
Fisher ratio Time domain Fisher analysis • Evaluation in the slowness domain
Low S/N ratio signals • F: Fisher statistic value, SNR: Signal to Noise Ratio in terms of Power, N: Number of array elements • Usually, F > 3 indicates more than 90% change of a coherent signal (F may be lower than 3) • For N=16 SNR=0.125 (Amplitude Ratio=0.3)
Infrasound from a meteor • Time since 2001.10.27 19u28m47.4s UT • From 400 to 500 s slight increase in amplitude and frequency • Band pass filter 0.5 to 1.5 Hz
Frequency domain Fisher analysis • Frequency–slowness power spectrum • Fisher coherency
Frequency-slowness analysis Single frequency slowness plot
24 hours of infrasound data Time axis starts on 2001, July 28
Summary and outlook • Detection of small signals is essential in infrasound, the lowest yield explosions are of interest, wind and temperature profiles determine signal amplitudes • Many sources of infrasound are recorded, some are yet unknown • Back azimuth and arrival time are needed to localize infrasonic events, more parameters are helpful • High wind noise reducers may be small and smart arrays