Download
1 / 15
150 likes | 298 Views
Embedded Computing Cluster: NFS Server Analysis. Abraham Murray. CS577: Advanced Computer Networks. Outline. Project Abstract System Overview Measurement Approach Measured Results Aggregate Results Per Client Results Per File Results Per User Results Result Analysis.

E N D
Embedded Computing Cluster:NFS Server Analysis Abraham Murray CS577: Advanced Computer Networks
Outline • Project Abstract • System Overview • Measurement Approach • Measured Results • Aggregate Results • Per Client Results • Per File Results • Per User Results • Result Analysis CS577: Advanced Computer Networks
Abstract • Our Embedded Computing Cluster: • Runs 80 diskless nodes to save cost • Uses high bandwidth data fabrics • Allows NFS file systems to perform well • 1 NFS server for 80 nodes • Runs proprietary software (light on details) • Open-source Linux infrastructure • Intent is to measure and analyze NFS server performance • Any nodes using disproportionate resources? • What are the five busiest client nodes? • Is the workload bursty or constant? • How does the workload change over time? • What files/directories are most heavily requested? CS577: Advanced Computer Networks
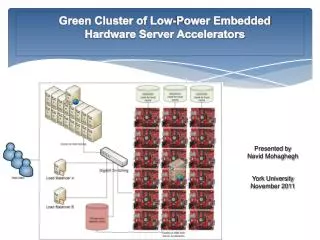
System Overview • System nodes embedded PowerPC • Combination of Myrinet data fabric, and Gigabit Ethernet • Myrinet is point-to-point switched data fabric, 2 Gbps full duplex • Multi-role system, variety of proprietary software • VoIP, communications support, DSP • “General Purpose Processors” Myrinet Gigabit Ethernet System Server Diskless Node nfsdump ramdisk HDD NFS Client NFS Server DisklessNodes DisklessNode(Router) DisklessNodes CS577: Advanced Computer Networks
Measurement Approach • Measurement Tools: • nfsdumpmodification to support NFS-specific attributes • nfsscanPerl script to automate data analysis of nfsdump outputs • Presented at LISA XVII, October 2003 by Ellard, Seltzer • Measurement Approach: • Task system consistently • Run tools on NFS server (ISSUE!) • Anonymize results for presentation CS577: Advanced Computer Networks
Aggregate Server Results Table 1 – Aggregate Server Operation Counts[1] [1]#cmdline ./nfsscan -t 0 -l -o nfsscan_results ./nfsdump_results.txt Table 2 – Server Statistics CS577: Advanced Computer Networks
! Aggregate Server Results booting 1st software load 2nd software load CS577: Advanced Computer Networks
Per Client Results Table 3 – 15 Busiest Clients Operation Counts[1] [1] #cmdline ./nfsscan -t 0 -BC -l -o nfsscan_results ./nfsdump_results.txt CS577: Advanced Computer Networks
! ! ! Per Client Results – DSP Nodes • Clients #68, 70, 71 retasked at 18 minutes to run concurrent DSP CS577: Advanced Computer Networks
Per Client Results – VoIP Node • Client 90 boots in 1.6 minutes, launches initial software from 2-3.5 minutes CS577: Advanced Computer Networks
Per Client Results – Router Node • Client 65 boots in 1.7 minutes. This is a Gigabit-Myrinet routing node • DHCP-relay, IP-forwarding, OSPF routing node CS577: Advanced Computer Networks
Per File Results Table 4 – 20 Busiest Files and Directories Operation Counts[1] [1] #cmdline ./nfsscan -t 0 -BF -f -d -l -o nfsscan_results ./nfsdump_results.txt CS577: Advanced Computer Networks
Per File Results - Histogram CS577: Advanced Computer Networks
Per User Results Table 5 – Per User Operation Counts[1] [1]#cmdline ./nfsscan -t 0 -BU -l -o nfsscan_results ./nfsdump_results.txt CS577: Advanced Computer Networks
Result Analysis • The top 5 busiest nodes are responsible for 60% of NFS traffic • The NFS workload is bursty, and follows operator-system tasking • Majority of accessed files are touched less than 80 times • Once per client • More regularly accessed files might belong in ramdisks • Reduce # NFS Operations by up to 60%! CS577: Advanced Computer Networks