Download
1 / 28
280 likes | 281 Views
Learn how to graph linear functions, identify linear equations, and evaluate functions in function notation. Practice solving problems and graphing functions with given domains.

E N D
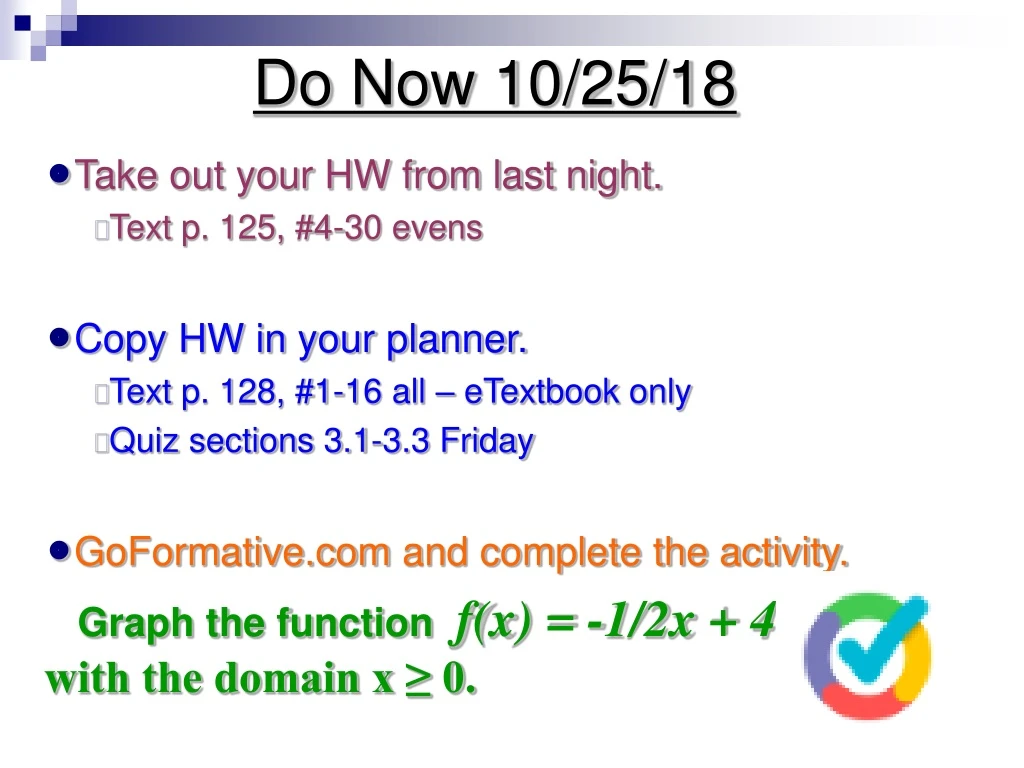
Do Now 10/25/18 • Take out your HW from last night. • Text p. 125, #4-30 evens • Copy HW in your planner. • Text p. 128, #1-16 all – eTextbookonly • Quiz sections 3.1-3.3 Friday • GoFormative.com and complete the activity. Graph the function f(x) = -1/2x + 4 with the domain x ≥ 0.
– x+ 4 Graph the functionf(x)= with domainx ≥0. Then identify the range of the function. 1 2 Graphing a Function STEP1 Make a table. STEP 2 Plot the points. Connect the points with a ray because the domain is restricted. STEP3 Identify the range. From the graph, you can see that all points have a y-coordinate of 4 or less, so the range of the function is y ≤ 4.
Learning Goal Learning Target • SWBAT identify functions and linear functions and evaluate, solve, and graph functions in function notation • SWBAT identify, write, graph, and transform linear functions
Set 1 Set 2 RELATION Domain Range Input Output X-coordinate Y-coordinate Independent Dependent -can be ANY value in the domain -DEPENDS on the input values -”y varies depending on the value of x”
2468 1234 RELATION MAPPING DIAGRAM GRAPH Input Output
Is a relation that pairs each input with EXACTLY ONE output. FUNCTION-
2468 0101 35 5123 Is a relation that pairs each input with EXACTLY ONE output. FUNCTION- FUNCTION NOT A FUNCTION Each input must be paired with only ONE output
Section 3.2 “Linear Functions” LINEAR FUNCTION- -has a constant rate of change (slope) and can be represented by a linear equation in two variables. A linear equation in two variables,x and y, is an equation that can be written in the form y = mx + b, where, m and b, are constants.
-has a constant rate of change (slope) and its graph is a LINE. -does not have a constant rate of change (slope) and therefore, its graph is NOT a line. LINEAR FUNCTION- NONLINEAR FUNCTION-
Identifying Linear Functions Using Equations A linear equation in two variables, x and y, is a LINEAR FUNCTION if it can be written in the form y = mx + b Yes, the equation can be written in the form y = mx + b No, the equation cannot be written in the form y = mx + b No, the equation cannot be written in the form y = mx + b Yes, the equation can be written in the form y = mx + b
Graphs of Linear Functions -set of input values that consists of all numbers in an interval -set of input values that consists of only certain numbers in an interval DISCRETE- CONTINUOUS- The domain of the function depends on the real- life context of the function
Section 3.3 “Function Notation” Function Notation- a linear function written in the form y = mx + b where y is written as a function f. x-coordinate f(x) = mx + b This is read as ‘f of x’ slope y-intercept f(x) is another name for y. It means “the value of f at x.” g(x) or h(x) can also be used to name functions
On Your Own For find the value of x for which g(x) = -4. Evaluate f(x) = 2x – 7 when x = 4? f(4) = 2(4) – 7 (-4) = 1/3x – 2 Simplify -2 = 1/3x f(4) = 8 – 7 f(4) = 1 -6 = x When x = 4, f(x) = 1 When x = -6, g(x) = -4
Domain and Range • Domain = values of ‘x’ for which the function is defined. • Range = the values of f(x) where ‘x’ is in the domain of the function f. • The graph of a function f is the set of all points (x, f(x)).
Graphing a Function Graph the function y = 4 – 2x with the domain -2, -1, 0, 1, and 2. Then identify the range of the function. y-axis 10 (-2,8) 8 (-1,6) 6 4 (0,4) -2 8 (1,2) 2 -1 6 -12 -10 -8 -6 -4 -2 0 2 4 6 8 10 12 0 4 x-axis (2,0) -2 1 2 -4 2 0 -6 -8 The range of the function is discrete and is 0, 2, 4, 6, 8. -10
Graphing a Function Graph the function f(x) =3/2x – 2 . y-axis 10 8 6 -4 -8 (4,4) 4 2 -2 -5 (2,1) -12 -10 -8 -6 -4 -2 0 2 4 6 8 10 12 0 -2 x-axis (0,-2) -2 2 1 -4 4 4 (-2,-5) -6 -8 The graph is continuous because there are no restrictions on the domain. (-4,-8) -10
When it is your turn, select one stick (problem) from the cup. Solve that numbered problem from the worksheet. • All other players also solve the problem. The player who picked the stick MUST prove that their answer is correct. If they get it correct, keep the stick and pass the cup to the left. If they get it incorrect, put the stick back in the cup and pass to the left. • If you pull the ZAP!! you lose all of your sticks! Try not to get Zapped!! Most points at the end wins!! Winner from each group earns Schoology badge Reverse – switch the order in which you pick sticks Skip – miss a turn Give a Stick – give one of your sticks to another player Take a Stick – take a stick from another player Zap – put all your sticks back in the cup.
Homework • Text p. 128, #1-16 all
3.1-3.3 Review 1) 2) 3) 4)
3.1-3.3 Review 5) 9) 6) 10) 7) 11) 8) 12) 13) 14)
3.1-3.3 Review 15) 19) 16) 20) 17) 21) 18) 22)
3.1-3.3 Review 23) 25) 24)