Download
1 / 22
220 likes | 229 Views
Modelling Long-term Commodities: the Development of a Simulation Model for the South African Wine Industry within a Partial Equilibrium Framework. Presenters: Michela Cutts Sanri Reynolds Other authors: Ferdi Meyer Nick Vink. From Regulated to Competing in the International Arena.

E N D
Modelling Long-term Commodities: the Development of a Simulation Model for the South African Wine Industry within a Partial Equilibrium Framework Presenters: Michela Cutts Sanri Reynolds Other authors: Ferdi Meyer Nick Vink
From Regulated to Competing in the International Arena The dynamic, recursive partial equilibrium model built to assist the industry by answering “WHAT IF” questions
Sin Tax “What If” MELBOURNE (Reuters) - Australia's drought could cut the 2008 wine grape vintage by more than half. Climate change risks devastating South Africa's wine and fruit industries Australian warning on oversupply - Worldbeat Price and Exchange Rate Changes
Data • Domestic data: South African Wine Industry Council’s information unit, South African Wine Information and Systems (SAWIS). • International Prices: Compendium of Wine Statistics • Competing Crops: Abstract of Agricultural Statistics • Macroeconomic variables: South African Reserve Bank and Statistics South Africa websites
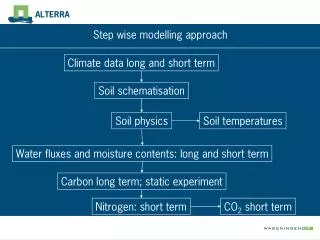
Methodology • Methodology developed by the Food and Agricultural Policy Research Institute (FAPRI) at the University of Missouri • Adapted to suit the nature of a long-term commodity
Wine Grape Supply Block • Divided into 8 production regions • South Africa’s top 10 varietals by volume • Given different slopes, trellising practices etc, vine numbers are used • Grape production per varietal = vine numbers x yield
Farmer’s Decision Making Process Plant vines or alternative fruits/crops based on expected real gross return Fruits/crops vines Fruit/crop sector level model Choice of varietal -based on weighted sum of expected real gross returns allows for determination of cross price elasticities with competing crops and different varietals
From Grapes to Wine • Juice (litres) = 0.85 x Grape production (tons) Juice Non-alc. Good wine Distilling wine Rebate wine
Domestic Demand Estimated for rebate, distilling wine and good wine No quality attributes considered for wine. Per capita consumption = f(real wine price, GDP/capita) Export Demand Disaggregated into red and white wine Individual equations estimated for 10 country groupings Exp dem = f(exch, lagged exports, SA price, new world wine price) Wine Demand Block
Linking Grape and Wine Price equations create the “link” between “grapes” and “wine” • Noble varietals price= f(lagged variety price, real wine price, and production of the variety) • Non-Noble varietals price= f(lagged variety price, real rebate and distilling wine price, and production of the variety) • Wine price=f(producer wine sales, wine production, exchange rate) • Rebate price = f(wine price, rebate wine production) • Distillate price=f(Rebate price, distillate production)
The Closing Block • For equilibrium to be reached total demand = total supply • System is closed using “change in stock” • wine production plus wine imports, less exports and domestic consumption
The Baseline – A Possible Outlook • A benchmark of likely trends and levels of prices, production, consumption and trade under a particular set of assumptions • Does not constitute a forecast
Macroeconomic Assumptions Sources: Global Insight
What if… • …the Rand appreciates relative to the baseline? • Baseline: Rand depreciates gradually from R7.18/USD in 2007 to R10.40/USD in 2014? • Scenario: What if Rand stays constant over the baseline at R7.18/USD?
Conclusion • So how do you use these results? • Evaluate results critically and decide whether you agree • It teaches us something about the system, market structures and price formation • How exogenous factors influence the business and policy environment