Download
1 / 49
540 likes | 734 Views
Chapter 4: Transfer Function Analysis. 4.1 Introduction. Previously we have only considered modelling of a single time series Y t , i.e., Y t is linearly related to its past values.

E N D
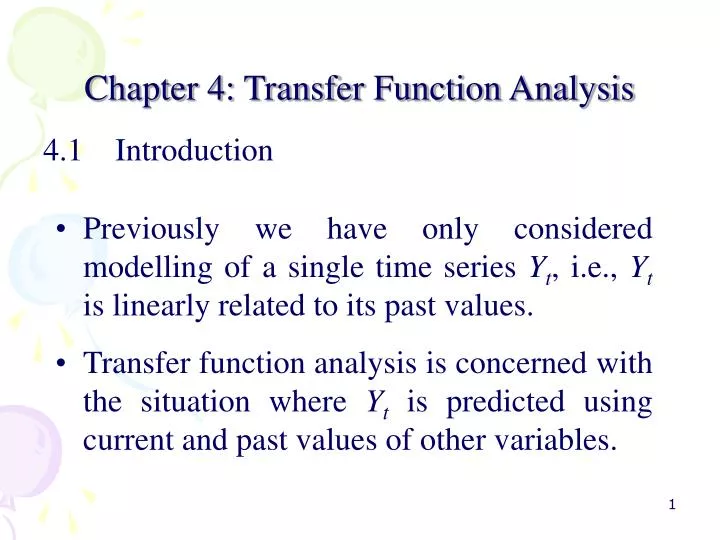
Chapter 4: Transfer Function Analysis 4.1 Introduction • Previously we have only considered modelling of a single time series Yt, i.e., Yt is linearly related to its past values. • Transfer function analysis is concerned with the situation where Yt is predicted using current and past values of other variables.
For example, the monthly sales of a company may be related to its monthly advertising expenditure - Our concern here is to predict the future monthly sales. - If we think that monthly sales is somewhat affected by advertising expenditure, then by incorporating the information on advertising, we may be able to give better sales forecasting.
Transfer function is concerned with situations similar to the above example. The time series being forecasted (Yt) is called the output series, while the time series (Xt) which helps explain the movement of Yt, Yt–1, Yt – 2 … is called the input series.
4.2 Nature of transfer function Assumptions and terminology: • Observations for the various series occur at equally spaced intervals. • Input series is not affected by the output series; i.e., we are limited to single equation models. • Both the input and output series are stationary.
The model may be written as: Yt = V0Xt + V1Xt–1 + V2Xt–2 + VRXt–k + Nt =V(B)Xt + Nt (4.1) where V’s are the unknown parameters, and Nt is the noise series, which represented the combined effects of other factors affecting the output series. • Nt may be autocorrelated, but is assumed to be independent of Xt. • The parameters V0, V1… etc. are called impluse response weights. • V0 states how Yt responds to a change in Xt, V1 states how Ytresponds to a change in Xt-1 and so on.
The larger the absolute value of any weight Vk, the larger the response of Yt to a change in Xt–k. In theory, this distributed lag response could be of infinite length. • Ytoften does not respond immediately to a change in Xt, that is, some initial weights may be zero. For example, the company advertising expense may not affect the sales immediately. It may take up a month for the market to digest the advertising effects. Hence V0 = 0.
- The number of v weights equal to zero is called the dead time, denoted as b. - Also, the order (k) of the transfer function can be rather larger. To avoid infinite number of weights, (2.1) is often written as where W(B) = W0– W1B – W2B2 – … WsBs δ(B) = 1 – δ1B – δ2B2 – … δrBr
This effectively expresses the infinite order transfer function as the ratio of two finite order polynomial. For example, consider W(B) = 1.2 – 0.5B and δ(B) = 1 – 0.8B then V(B) = (1.2 – 0.5B)(1 + 0.8B + (0.8)2B2+…) = 1.2 + 0.46B + 0.368B2 + 0.924B3 + …
Overtime, the full change in Yt in response to unit’s change in Xtis given by, where g is called a steady-state gain of the transfer function.
4.3 Nature of impulse response function • In ARIMA model, the model identification consists of matching sample autocorrelation and partial autocorrelation functions to the theoretical AL and PAL of specific ARIMA models. • In transfer function models, the same approach is used. We match the sample cross correlation function to the theoretical impulse response functions. It is necessary that we investigate the impulse response function and determine what various patterns in the weights V0, V1, V2… imply about b, r and s. Very often, we find that the values of r and s do not exceed 2.
Vk lag 0 1 2 3 Case 1: r = 0, s = 0 and b = 0 Since the impulse response function is defined as this implies V0 + V1B + V2B2 + …=W0 B0 : V0 = W0 Bk : Vk = 0 k > 0 Equating the coefficients of B, we get Therefore, the transfer function model is Yt = W0Xt, i.e., Yt changes by W0 units immediately for every unit change in Xt. Impulse response function graph is:
Vk lag 0 1 2 3 Case 2: r = 0, s = 0 and b = 1 The transfer function is V0 + V1B + …V2B2 + …=W0B Equating the coefficients of B, we get B0 : V0 = 0 B1 : V1 = W0 Bk : Vk = 0 ; k 2 Therefore, the transfer function model is Yt = W0BXt = W0Xt–1 i.e., Yt changes by W0 units immediately for every unit change in Xt–1. Impulse response function graph is: For a non-zero b in general, Vk = 0 for all k b, and Yt = W0BbXt = W0Xt–b
Vk lag 0 1 Case 3: r = 0, s = 1 and b = 0 V(B) = W0 – W1B B0 : V0 = W0 B1 : V1 = –W1 Bk : Vk = 0 k 2 Therefore, the transfer function model is Yt = W0Xt– W1Xt–1 i.e., changes in Xtlead to changes inby Ytand Yt–1. Impulse function graph is: Depending on the values of the coefficients, the impulse response function has either positive or negative spikes or combination of both at lags 0 and 1.
Vk lag 0 1 2 3 Case 4: r = 0, s = 1 and b = 1 V(B) = W0 B– W1B2 B0 : V0 = 0 B1 : V1 = W0 B2 : V2 = –W1 Bk : Vk = 0 k 3 Therefore, the transfer function model is Yt = W0Xt–1 – W1Xt–2 i.e., changes in Xtlead to changes in Yt+1 and Yt+2. Impulse response function graph is: Depending on the values of the coefficients, the impulse response function has either positive or negative spikes or combination of both at lags 1 and 2.
Vk lag 0 1 2 3 Case 5: r = 0, s = 2 and b = 0 V(B) = W0– W1B – W2B2 B0 : V0 = W0 B1 : V1 = –W1 B2 : V2 = –W2 Bk : Vk = 0 k 3 Therefore, the transfer function model is Yt = W0Xt– W1Xt–1 – W2Xt–2 i.e., changes in Xtlead to changes in Yt, Yt+1 and Yt+2. Impulse response function graph is:
Vk lag 0 1 2 3 4 5 Case 6: r = 1, s = 0 and b = 0 The transfer function is with (V0 + V1B + V2B2 + …)(1– δ1B)= W0 B0 : V0 = W0 B1 : V1– V0δ1 = 0 V1 = V0δ1 = W0 δ1 B2 : V2 – V1δ1 = 0 V2 = V1δ1 = W0 δ12 Bk : Vk = W0 δ1k for k 0 Impulse response function graph is: The transfer function model is Yt = W0Xt + W0δ1Xt–1 + W0δ12Xt–2 + … that is, changes in Xt lead to changes in Yt, Yt+1, Yt+2 with the effect dying out geometrically.
Vk lag 0 1 2 3 Case 7: r = 1, s = 1 and b = 0 The transfer function model is with (V0 + V1B + V2B2 + …)(1– δ1B)= W0 – W1B B0 : V0 = W0 B1 : V1– V0δ1 = –W1 V1 = V0δ1 – W1= W0 δ1–W1 B2 : V2 – V1δ1 = 0 V2 = V1δ1 = W0 δ12 – W1δ1 Bk : Vk = Vk–1δ1 =W0 δ1k – W1 δ1k–1 for k 1 Impulse response function graph is: The impulse response function decays from lag 1 geometrically but the impulse at lag 0 does not follow any decay pattern. Changes in Xt lead to changes in Yt, Yt+1, Yt+2 with the effects dying out geometrically from lag 1.
VR lag 0 1 2 3 4 Case 8: r = 1, s = 2 and b = 0 The transfer function is with (V0 + V1B + V2B2 + …)(1– δ1B)= W0 – W1B – W2B2 B0 : V0 = W0 B1 : V1– V0δ1 = –W1 V1 = V0δ1 – W1= W0 δ1–W1 B2 : V2 – V1δ1 = –W2 V2 = V1δ1 – W2 = W0 δ12 – W1δ1 – W2 Bk : Vk = Vk–1δ1 =δ1k–2(W0δ12 – W1δ1 – W2) for k 2 Impulse response function graph is: The impulse response function decays from lag 2 geometrically but the impulse at lags 0 and 1 do not follow any decay pattern. Changes in Xt lead to changes in Yt, Yt+1, Yt+2 with the effects dying from lag 2.
Case 9: r = 2, s = 0 and b = 0 The transfer function is with (V0 + V1B + V2B2 + …)(1 – δ1B – δ2B2) = W0 B0 : V0 = W0 Bk : Vk = Vk–1δ1 – Vk–2δ2 for k 1 Depending on the values of δ1 and δ2, Vk decays slowly or follows a damped sinewave from lag 1 with V0 not following any decaying pattern.
Case 10: r = 2, s = 1 and b = 0 The transfer function is with (V0 + V1B + V2B2 + …)(1 – δ1B – δ2B2) = W0 – W1B B0 : V0 = W0 B1 : V1 = δ1W0 – W1 Bk : Vk = Vk–1δ1 – Vk–2δ2 for k 2 Depending on the values of δ1 and δ2, Vk decays slowly or follows a damped sinewave from lag 2 with V0 and V1 not following any decaying pattern.
In summary, δ(B) represents the decay pattern with W(B) captures unpatterned spikes (not part of the decay pattern)
4.3 Building a transfer function model Our goals are • To find a parsimonious expression for the polynomial V(B) as a ratio of other polynomials of lower order. • To find a parsimonious expression for the time structure of the disturbance series Nt in the form of an ARIMA model. The ARIMA model for the Nt series is given by P(B)P(BL)Nt = q(B)Q(BL)t where tis white noise. So the transfer function becomes,
The procedure of building a transfer function model involves three steps: Step 1 : Identification of a model describing Xt and “pre-whitening” of both the input and output series. Step 2 : Calculation of the sample cross correlation between the pre-whitened series and the identification of a preliminary transfer function model. Step 3 : Identification of an ARIMA model for the noise series.
Step 1 : For purposes of illustration, we consider the data given in Table 14.1 of Bowerman and O’Connell (1993) on monthly advertising (Xt) and sales (Yt), as depicted in the following graphs.
Figure 4.1: Monthly advertising expenditure (in thousands of dollars)
It is identified that Xt is best described by an ARIMA (1, 1, 1) model with and Ytby an ARIMA (2, 1, 1) model with • It is easier to construct a transfer function using only stationary input and output series. For purposes of convenience, we denote the appropriately differenced and transformed series of Xt and Yt as xt and yt respectively.
Furthermore, experience has shown that the identification process is simplified if the input series is white noise. We do this by pre-whitening the input series. Suppose that we have identified an ARMA (p, q) (P, Q)Lmodel for xt. i.e. p(B)P(BL)xt = q(B)Q(BL)t where t is white noise. Then the series t is called the pre-whitened series with
In practice, t is known and estimated by the residual of the ARMA model for xt. For example, the first difference of the advertising expenditure series can be written as, Although in most cases, we write t instead of
But recall that the transfer function model is written as yt = V(B)xt + Nt. Pre-whiten the input series means that we have to multiply the entire transfer function by
This operation is called “pre-whitening” the input and output series. But note that t is not necessarily white noise. Why? • The “pre-whitened” transfer function is
Step 2 : • To identify the transfer function, we must estimate the impulse response function V(B) from the pre-whitened input and output series and then match the pattern of the estimated function to that of the theoretical impulse response function. • We first establish the relationship between the impulse weights and the series. Now, multiply the pre-whitened transfer function Bt = V(B)t + t by t– k and take expectation, we obtain the cross-covariance for Bt and t at lag k defined as
As t and t are independent (why?) hence, For k = 0, (0) = V02 k = 1, (1) = V12 In general, (k) = Vk2, k = 0, 1, 2 …
Therefore, the impulse response weights are proportional to the cross covariance. Now, the cross correlation coefficient of t and t at lag k is • Then we see that • Thus the cross-correlation coefficients between the pre-whitened input and output series are directly proportional to the impulse response weights.
(k) cannot be calculated in practice, so we compute its estimate using where are the sample means of and respectively. The sample cross correlation coefficients are computed for k = 0,1, 2 and so on. Since we assume that Yt is led by Xt, we except (k) = 0 for k < 0.
Since the sample cross correlation values are sample statistics, we need their standard errors to determine if any of them is significantly different from zero. • Bartlett approximates the standard error of • r(k) by The cross correlation • coefficient at lag k is insignificant at the 5% • level if
The following SAS program computes the pre-whitened input and output series and also the sample cross correlation coefficients: data sales; infile 'd:\teaching\ms4221\advertising.txt'; input @6 X Y; proc arima; identify var=X(1) noprint; estimate p=1 q=1 noconstant; identify var=y(1) crosscor=(x(1)) nlag=10; run;
Some identification rules 1) Determining b: • It is equal to the number of V weights that are equal to zero starting from V0. • In practice, we look for a set of zero value V weights in the sample cross correction function. For the advertising sales example, 2 appears to be appropriate.
2) Determining r: • If there is no decay pattern at all, but rather a group of spikes followed by a zero cut-ff, then r = 0. • If r(k) shows a geometrical decay pattern after some lags, then r = 1. • If r(k) decays slowly or shows a damped sinewave pattern, then r = 2. • For the above example, we choose r = 2.
Determining S • If r has been chosen to 0 or 2, then s = number of significant unpatterned spikes –1. • If r has been chose to 1, then s = number of significant unpatterned spikes. • For the above example, the decaying pattern starts from lag 3 and there is one significant spike preceding that. We have chosen r = 2, which implies that s = 1 – 1 = 0.
So we are led to choose the model, • Step 3 • After the transfer function model has been tentatively identified, an ARIMA process for the noise series must be considered, we do so by first estimating the tentatively identified transfer function model by maximum likelihood. The following SAS program shows an example.
data sales; infile 'd:\teaching\ms4221\advertising.txt'; input @6 X Y; proc arima; identify var=X(1) noprint; estimate p=1 q=1 noconstant; identify var=y(1) crosscor=(x(1)) nlag=10; estimate input=(2$/(1,2)x) noconstant method=ml plot; run;
The SAC and SPAC of the residuals indicate the strong possibility of MA(1) process. So we re-estimate the transfer function again as using the following SAS program:
data sales; infile 'd:\teaching\ms4221\advertising.txt'; input @6 X Y; proc arima; identify var=X(1) noprint; estimate p=1 q=1 noconstant noprint; identify var=y(1) crosscor=(x(1)) nlag=10 noprint; estimate q=1 input=(2$/(1,2)x) noconstant method=ml; plot; run;
This model appears to be adequate. The residuals are uncorrelated and all coefficients are significant. • Exante forecasts of Yt can be generated using the statement “Forecast lead = number of periods” immediately after the estimation statements.