Download

1 / 13
130 likes | 135 Views
Explore the factors affecting world population growth, including the natural increase rate (NIR), fertility rates, crude birth rate (CBR), crude death rate (CDR), total fertility rate (TFR), infant mortality rate (IMR), and life expectancy. Understand the geographic distribution of these factors and their impact on different regions.

E N D
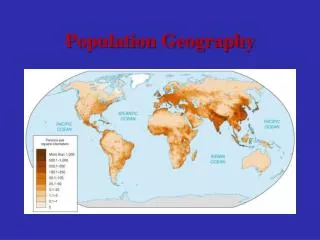
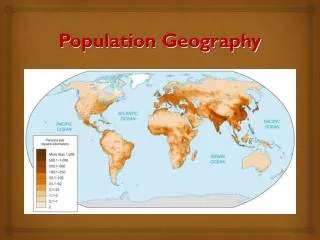
Population Geography B Where Has the World’s Population Increased?
Natural Increase Rate:NIR The world’s NIR is 1.3, meaning that the world’s population is growing by 1.3% each year -the highest NIR was 2.2%in 1963 NIR has declined sharply in the past 10 years About 80 million people are being added to the population each year -the highest was 89 million in 1989
World population went from: 3 to 4 billion in 14 years 4 to 5 billion in 13 years 5 to 6 billion in 12 years If the NIR went from 1.25 down to 1, world population would increase 64 million per year instead of 80 million This is a drastic change!! Similarly, if NIR went from 1.25 up to 2, annual world increase would be 128 million
Doubling time: the number of years needed to double a population, assuming a constant NIR -if NIR remains at 1.3, it will take about 54 years to double population -by 2100, global population would reach 24 billion! A country with 2% NIR will have its population double in about 35 years
Virtually all natural increase is found in Lesser Developed Countries (LDC’s) -NIR is over 2% in most sub-Saharan African, Asian, and Latin American nations -NIR is close to zero or negative in most European countries -we do not count immigration with NIR
Fertility Crude Birth Rate (CBR): total number of live births in a year for every 1000 people alive in a society -CBR of 20 means that 20 live births occur for every 1000 people in a population each year
Crude Death Rate (CDR): total number of deaths in a year for every 1000 people alive in a population -expressed the same way as CBR
The map of CBR is closely related to the map of NIR Highest CBR in sub Saharan Africa (many countries have CBR over 40) Lowest CBR in Europe (many countries under 10)
Total Fertility Rate (TFR): the average number of children a woman will have throughout her childbearing years (15-49) -helps to measure the total number of births in a population -CBR looks at a society in a given year, while TFR attempts to predict the future behavior of women in a world of rapid cultural change -World TFR is about 3.0 -exceeds 6 in many sub-Saharan African countries -less than 2 in most European countries
Mortality Infant Mortality Rate (IMR): annual number of deaths of infants under one year of age compared to the total number of live births -usually expressed as number of deaths per 1000 births
IMR exceeds 100 in some LDCs (10% of all babies die before their first birthday) IMR below 10 in many Western European countries IMR reflects a country’s healthcare system -where would well-trained doctors, modern hospitals, and large supplies of medicine be found? Life Expectancy: measures the number of years a newborn infant can expect to live at current mortality levels -in Europe, life expectancy in upper 70s -sub-Saharan African nations expectancy in the upper 30s
CDR map is different than the others we have looked at -less differences in CDR between MDCs and LDCs -less extreme variation -in CBR, range from 8 to 55 -in CDR, range only from 3 to 22 Denmark has higher CDR than Mongolia U.S. has higher CDR than Mexico Why? That is the next key issue to address