Download
1 / 1
10 likes | 137 Views
Bike and Pedestrian Counting Project: Santa Cruz. Why do we count?. Scotts Valley. Abstract. 10 Locations Countywide.

E N D
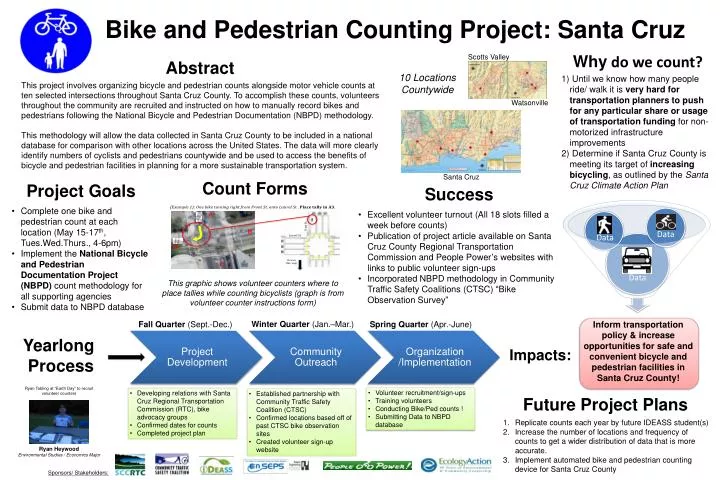
Bike and Pedestrian Counting Project: Santa Cruz Why do we count? Scotts Valley Abstract 10 Locations Countywide Until we know how many people ride/ walk it is very hard for transportation planners to push for any particular share or usage of transportation funding for non-motorized infrastructure improvements Determine if Santa Cruz County is meeting its target of increasing bicycling, as outlined by the Santa Cruz Climate Action Plan This project involves organizing bicycle and pedestrian counts alongside motor vehicle counts at ten selected intersections throughout Santa Cruz County. To accomplish these counts, volunteers throughout the community are recruited and instructed on how to manually record bikes and pedestrians following the National Bicycle and Pedestrian Documentation (NBPD) methodology. This methodology will allow the data collected in Santa Cruz County to be included in a national database for comparison with other locations across the United States. The data will more clearly identify numbers of cyclists and pedestrians countywide and be used to access the benefits of bicycle and pedestrian facilities in planning for a more sustainable transportation system. Watsonville Santa Cruz Count Forms Project Goals Success • Complete one bike and pedestrian count at each location (May 15-17th, Tues.Wed.Thurs., 4-6pm) • Implement the National Bicycle and Pedestrian Documentation Project (NBPD) count methodology for all supporting agencies • Submit data to NBPD database • Excellent volunteer turnout (All 18 slots filled a week before counts) • Publication of project article available on Santa Cruz County Regional Transportation Commission and People Power’s websites with links to public volunteer sign-ups • Incorporated NBPD methodology in Community Traffic Safety Coalitions (CTSC) “Bike Observation Survey” This graphic shows volunteer counters where to place tallies while counting bicyclists (graph is from volunteer counter instructions form) Winter Quarter (Jan.–Mar.) Inform transportation policy & increase opportunities for safe and convenient bicycle and pedestrian facilities in Santa Cruz County! Fall Quarter (Sept.-Dec.) Spring Quarter (Apr.-June) Yearlong Process Impacts: Ryan Tabling at “Earth Day” to recruit volunteer counters • Volunteer recruitment/sign-ups • Training volunteers • Conducting Bike/Ped counts ! • Submitting Data to NBPD database • Developing relations with Santa Cruz Regional Transportation Commission (RTC), bike advocacy groups • Confirmed dates for counts • Completed project plan • Established partnership with Community Traffic Safety Coalition (CTSC) • Confirmed locations based off of past CTSC bike observation sites • Created volunteer sign-up website Future Project Plans Replicate counts each year by future IDEASS student(s) Increase the number of locations and frequency of counts to get a wider distribution of data that is more accurate. Implement automated bike and pedestrian counting device for Santa Cruz County Ryan Heywood Environmental Studies / Economics Major Sponsors/ Stakeholders: