Download
1 / 98
980 likes | 1.1k Views
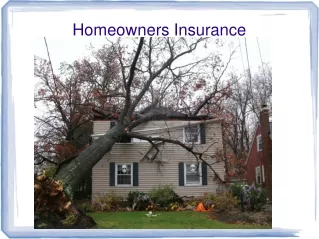
Homeowners Insurance in Alabama. November 7, 2011 Alabama Department of Insurance Commissioner Jim L. Ridling. Alabama Department of Insurance.

E N D
Homeowners Insurance in Alabama November 7, 2011 Alabama Department of Insurance Commissioner Jim L. Ridling
Alabama Department of Insurance • Our mission is to serve the people of Alabama by regulating the insurance industry, providing consumer protection, promoting market stability, and enforcing fire safety standards and laws
Alabama Department of Insurance • Licenses insurance producers (agents) and agencies • Licenses insurance companies and pre-need providers • Examines insurance companies for financial solvency and market conduct • Provides consumer protection and assistance
Alabama Department of Insurance • Fiscal year budget: $16.6 million • Tax generating agency • Funded through fees collected (licensing fees, primarily) • 150 employees • 100 in Montgomery • 25 field examiners • 25 deputy fire marshals
The DOI Perspective • Despite the tragedy of April 27, the homeowners insurance market remains relatively vibrant in 65 of the state’s 67 counties • Homeowners insurance remains readily available despite the decision of a company to non-renew a segment of its business
The DOI Perspective • The problems in Alabama’s coastal counties have endured for a variety of reasons • Subsequent storms in coastal areas: Rita, Ike, etc. • Expected increase in tropical activity • Economic downturn
The DOI Perspective • In the balance of the state, the DOI is not receiving significant numbers complaints from consumers regarding access to insurance • Some complaints regarding the loss of coverage from a single carrier, but not widespread • The Department believes the issues will be overcome as carriers contemplate Alabama as a marketplace
Definition of Insurance • Insurance is defined as the equitable transfer of the risk of a loss, from one entity to another, in exchange for payment. • Insurance involves pooling funds from many similar insured entities to pay for the losses that some insureds may incur: Law of Large Numbers says that the predicted losses for the pooled insureds will be similar to the actual losses.
INDUSTRY HOMEOWNERS RESULTS • We’ve defined the Homeowners problem from the coastal consumer’s perspective. Now let’s look at it from the insurer’s perspective. • Over the 7 years 2003-2009: • Insurance companies in Alabama have paid out approximately $117 for Homeowners claims and operating expenses for every $100 of premiums they have collected; • Insurance companies Countrywide paid out approximately $97 for every $100 they collected.
INSURERS REQUIRE CAPITAL • Based on the law of large numbers, the premium collected should be sufficient, on average over many years, to cover the losses incurred. • However, in any given year, there is roughly a 50% chance that losses will exceed the portion of premium collected to pay for those losses. • Therefore, insurers must maintain capital over and above the premium they collect in order to be certain they can pay all claims.
INSURERS REQUIRE CAPITAL • Typically, insurers maintain as much additional capital as they collect in premiums in order to be assured they can cover claims in the most adverse years. (Premium-to-surplus ratio = 1.0) • Where do insurers obtain this additional capital? From investors. • What do investors require from insurers in return for loaning them this additional capital? Investment income. • What’s a reasonable rate of return for investors to make on this capital loan? 11%?
INSURANCE INDUSTRY RESULTS • Return on Net Worth for 1990-2009: • Property/Casualty Industry = 7.3% • Avg. of 227 other industries = 10.7% • P/C Industry ranked 163 out of 228* industries • P/C Industry ROE was lower than the 227- industry average for 18 of the 20 years * # of industries in S&P’s COMPUSTAT database for which 20 years of data was available.
INSURANCE INDUSTRY RESULTS • Return on Net Worth for 2000-2009: • Property/Casualty Industry = 6.3% • Avg. of 301 other industries = 9.4% • P/C Industry ranked 200 out of 302* industries • P/C Industry ROE was lower than the 301- industry average for all 10 years * # of industries in S&P’s COMPUSTAT database for which 10 years of data was available.
INDUSTRY HOMEOWNERS RESULTS Homeowners Return on Net Worth: 2000-2009 Louisiana -32% Mississippi -29% Missouri -12% Kentucky -9% Alabama -8% Arkansas -7% Georgia -7% Nebraska -7% Tennessee -5% Texas -2% Oklahoma -2% Florida 0% W. Virginia +5% Virginia +10% N. Carolina +15% S. Carolina +21% Countrywide +5%
INDUSTRY ROE BY LINE OF BUSINESS2000-2009 ALCW P.P. Auto 9% 7% W.C. 8% 6% C. Auto 3% 8% CMP 3% 8% H.O. -8% 5% F.O. -17%5% TOTAL 3% 7%
INDUSTRY HOMEOWNERS RESULTS • Alabama’s -8% average Homeowners ROE over the last 10 years means that if a company had started with $1 billion in net worth 10 years ago, today the company would only have $434 million net worth remaining. • Companies must deploy their capital / net worth where they can achieve a reasonable return for their investors. Clearly a -8% averageROE does not make Alabama an attractive investment for companies. • On the Coast, approximately 70% - 80% of the Homeowners policy premium is required to cover wind losses. Upstate it is only about 20% - 35%. • A company’s Homeowners ROE can be improved in several ways: • Raise rates • Reduce the company’s exposure to loss by raising deductibles or excluding wind coverage • Shift to writing more policies Upstate and fewer policies on the Coast • Focus their coastal writings on homes that have been fortified; Improve building codes to lower the damageability of houses; retrofit homes to higher building standards
INDUSTRY HOMEOWNERS RESULTS • Companies must feel confident that over the long run they can make a profit on Homeowners insurance in Alabama, or they will choose not to offer insurance in our state and utilize their capital to write more business in other states. • The Dept. of Insurance permits companies to establish rates that over the long run should generate a profit margin on premiums of approximately 6% (which translates to less than 7% ROE, which is approximately the industry’s 2009 countrywide average). Despite that, insurers have not achieved those profit levels. • If the Dept. of Insurance were to arbitrarily suppress rates that companies could charge, companies would further reduce their writings in Alabama, thus exacerbating the availability (and thus affordability) of Homeowners insurance.
RATING AGENCIES • Insurers are rated by A.M. Best for their claims-paying ability, and by S&P, Fitch, and others as to their debt security. • Lower ratings by these agencies either drives down the marketability of their products or drives up the cost of their debt. • Pressure by these rating agencies may drive insurers to raise rates or reduce their exposure to losses so as to maintain a better rating.
ALABAMA RATE STATUTES • All Homeowners rate filings from admitted insurance companies require prior approval by the Department of Insurance. • Non-admitted (Surplus Lines) companies are not required to file their rates with the Department and the Department has no regulatory authority over their rates.
ALABAMA RATE STATUTES • Alabama statute says that rates must not be: * Excessive * Inadequate * Unfairly discriminatory
ALABAMA RATE STATUTES • Not excessive: We require that rates are actuarially justified, meaning the rates do not exceed those rates statistically justified by the insurance company’s claim history or models. • Not inadequate: We do permit insurance companies to utilize rates below their actuarially justified rates in order to be competitive, as long as it does not endanger the company’s financial solvency.
ALABAMA RATE STATUTES • Not unfairly discriminatory: We review each company’s rate structure to ensure that rates are not excessive for any individual territory, policy type, policy limit, deductible level, etc., separately for wind versus non-wind coverage.
WHAT MAKES UP THE HOMEOWNERS PREMIUM DOLLAR? In general, the breakdown in Homeowners premium might be as follows: CoastalUpstate Claims Payments = 23% 58% Reinsurance = 40% 5% Claims Adjusting Expense = 10% 10% Marketing Expense = 19% 19% Overhead Expense = 5% 5% Taxes, Licenses, Fees = 3% 3% Total = 100% 100%
WHAT MAKES UP THE HOMEOWNERS PREMIUM DOLLAR? For 2009, the breakdown in Homeowners premium statewide for Alabama was as follows: Claims Payments = 96% of direct earned premium* Claims Adjusting Expense = 15% Marketing Expense = 19% Overhead Expense = 5% Taxes, Licenses, Fees = 3% Total = 138% Investment Gain = 4% ROE = -24% * Before reinsurance
HOMEOWNERS RATE COMPONENTS • Most Companies publish a single combined Homeowners rate to cover all perils insured against. However, in providing justification for those rates, their data is segregated into non-wind and wind components by territory, and the Department of Insurance scrutinizes that justification.
HOMEOWNERS RATE COMPONENTS • The non-wind portion of a company’s Homeowners rates must be justified by the company’s Alabama non-wind claims experience statewide and by territory over the past 5 years. • For competitive reasons, for some or all territories, companies may choose to file for lower non-wind rates than those justified actuarially, and we generally permit this.
HOMEOWNERS RATE COMPONENTS • The wind portion of a company’s Homeowners rates consists of three components: • The hurricane rate • The non-hurricane wind rate • The cost of reinsurance
HOMEOWNERS RATE COMPONENTS • The hurricane rate is almost always developed from independent vendors’ computer models that predict the frequency and severity of hurricanes. The models estimate the average annual claims that the company will experience based on the policies they currently write in the state. These claim estimates are developed at the zip code level and then aggregated for each rating territory used by the company.
HURRICANE MODELS • Why are hurricane models used instead of actual hurricane experience? The significant variation in the frequency of different magnitudes of hurricanes diminishes the accuracy of historical hurricane loss experience for projecting expected loss levels for the policies to which proposed rates will apply. Average expected recurrence periods for the larger, more severe storms are so long that many external variables will change in the time periods between occurrences. For example, the area of southern Florida hit by Hurricane Andrew in 1992 was last hit by a major hurricane, Hurricane Betsy, in 1965. The type, number, value, vulnerability and geographical distribution of exposed properties in the area impacted by Hurricane Andrew are very different than those of the exposed properties in 1965. Actual loss statistics from a hurricane that occurred many years ago are not easily adjusted for the type, number, value, and vulnerability of present day structures.
HURRICANE MODELS Since historical hurricane losses cannot be used to accurately estimate current hurricane loss potential, insurers contract with an outside vendor, AIR or RMS, which use an alternative methodology based on Monte Carlo simulation to arrive at the insurer’s expected annual hurricane losses. This approach involves the development of computer programs that describe in detail the frequency of hurricanes, their meteorological characteristics, and their effects on exposed properties. A high-speed computer then simulates a large set of hypothetical hurricanes and estimates the resulting property losses based on the insurer’s exposure. In order to estimate the potential loss from hurricanes, 100,000 scenario years of potential hurricanes are simulated. This large number of simulations attempts to ensure that the resulting probability distribution of losses converges to a stable representative distribution of potential annual hurricane loss (the Law of Large Numbers at work again). The pattern of simulated hurricanes is representative of what has occurred historically because meteorological data on the actual events since 1900 were used to estimate the parameters of the hurricane simulation model. The meteorological sources used to develop the model are the most complete and accurate databases available from various agencies of the National Weather Service and the National Oceanic and Atmospheric Administration (NOAA), including the National Hurricane Center.
HURRICANE MODELS The primary characteristics of hurricanes used to simulate each storm and resulting wind speeds are: 1. Hurricane Frequency 2. Landfall Location 3. Central Pressure 4. Radius of Maximum Winds 5. Forward Speed 6. Track Angle at Landfall 7. Storm Track 8. Gradient Wind Reduction Factor 9. Peak Weighting Factor The probability distributions for several of these variables (2-6) are estimated for coastal segments of equal length from Texas to Maine. Random samples are generated from the probability distributions of these input variables to assign values to the variables for each simulated hurricane.
HURRICANE MODELS HURRICANE WIND SPEED ESTIMATION Once the key parameters have been generated, the meteorological relationships among them are used to develop a complete time profile of wind speeds for each location affected by the storm. This involves the following calculations for each simulated hurricane: 1. Gradient-Level Wind Speed 2. Adjustment to surface (10-meter) level 3. Storm Asymmetry 4. Storm Decay (Filling) 5. Radial Decay (Storm Center-Relative Wind Speed) 6. Adjustment of Wind Speed for Surface Friction and Averaging Time
HURRICANE MODELS DAMAGE ESTIMATION AND DEMAND SURGE Engineers have developed damage functions that describe the interaction between buildings, (including both structural and nonstructural components) and their contents, and the local wind speeds to which they are exposed. These functions relate the mean damage level as well as the variability of damage to wind speed at each location. Because different structural types will experience different degrees of damage, the damage functions vary according to construction class, occupancy, and height. The model estimates a complete distribution around the mean level of damage for each local wind speed and each structural type. Losses are calculated by applying the appropriate damage function to the replacement value of the insured property. The damage functions capture the effects of wind duration as well as the effect of peak wind speed. The longer a property experiences severe wind speeds, the greater the damage. The hurricane damageability relationships incorporate well-documented engineering studies published by wind engineers and other experts . They also incorporate the results of post-hurricane field surveys performed by engineers. These relationships are continually refined and validated based on actual client companies’ loss data. Any major hurricane event causes an increase in demand for materials and services to repair and rebuild damaged property. This can put pressure on costs, resulting in higher than expected costs. Therefore, models apply aggregate demand surge functions to loss estimates to take into account the combined effects of events clustered in both time and geography.
HURRICANE MODELS LOSS CALCULATION The insurer supplies the modeler with a detailed exposure database containing insured values by policy level and ZIP Code for each line of business, construction, and deductible combination. Damage functions relating wind speed and wind duration to the percentage of property damaged for varying types of coverage and construction are used to produce loss estimates by zip code for each simulated hurricane. MODELED LOSS ESTIMATES Losses estimated from 100,000 years of simulated potential hurricanes are summed and divided by 100,000 to produce the expected annual losses from all hurricanes for each ZIP Code. ZIP Code loss estimates are then aggregated to produce expected annual loss by county and state. Hurricane factors are then calculated as the total loss estimate for a given ZIP Code, county, or state divided by the total insured value in thousands of dollars (amount of insurance years). This factor is applied to the expected average amount of insurance years in the determination of the overall rate level indication.
HOMEOWNERS RATE COMPONENTS • The hurricane computer models are reviewed by a national industry expert panel every time they are revised to ensure that their statistical methodologies are valid. • These models are being regularly updated to include new analyses and data (such as climate change and recent storms) that affect the frequency and severity of hurricanes.
HURRICANE “MODEL MISS” • Despite the progress made in developing hurricane models, a study of the hurricanes of 2004, 2005 and 2008 show that the models typically under-estimated the losses that those hurricanes would generate for homes and small businesses. • The actual storm losses ranged from 84% to 188% of the losses predicted by the models. The average actual-to-predicted ratio was 128%. • The error in the model predictions was due to non-modeled perils, poor data quality, and model error.
HURRICANE MODEL VIEWS • As a result of climate change theories, hurricane modelers have developed two approaches to estimating future hurricane losses. Hurricane frequency changes cyclically, depending on whether we are experiencing a cycle of warm sea surface temperatures (WSST) or cooler sea surface temperatures. These cycles tend to run in 25-year spans on average. • The Long-Term View of the models utilizes data from all hurricanes that have ever occurred, regardless of the cycle phase in which they occurred. • The Near-Term View only utilizes data from hurricanes that have occurred in a cycle similar to the current cycle we are experiencing (i.e. only warm water cycles or only cold water cycles).
HURRICANE MODEL VIEWS • The U.S. is currently in a warm sea surface temperature cycle. This cycle tends to produce more hurricanes than the cold water cycle. • Most insurers and reinsurers would prefer to use the WSST view of the models, believing this is a better prediction of what will occur next year while we are still in a warm water cycle. • The DOI does not permit insurers to use the WSST view, but we cannot prevent the reinsurers from doing so.
HOMEOWNERS RATE COMPONENTS • The non-hurricane wind rate is developed from either the individual company’s 20- or 30-year historical claims data for Alabama or from industry claims data for Alabama. The losses for the 20 years are compared to the premiums for those 20 years to develop a non-hurricane wind load, which is then added to the hurricane load developed from the models. • In the case of the April, 2011 Alabama tornadoes, which may be considered a 1-in-250 year event, the DOI has announced that it will only permit 8% of these losses to be included in future rate filings. (8% / 20 years = 0.4% = 1/250).
HOMEOWNERS RATE COMPONENTS • The cost of reinsurance. Companies cannot risk having to pay the entire loss from a large hurricane or tornado outbreak, so they must purchase reinsurance. • Reinsurers use the same hurricane models as the companies, though they may utilize different assumptions, such as the Near-Term version. The rates for reinsurance that are charged to the companies are not regulated by the Dept. of Insurance, and the companies pass this cost on to their insureds in the premiums they charge.
COMPONENTS OF THE REINSURANCE COST LOAD If a reinsurer charges an insurer $1M for their Homeowners coastal catastrophe reinsurance coverage, the components of that premium are approximately: Expected Losses = $200,000 Risk Load & Profit = 600,000 Overhead Expense = 200,000 1,000,000
REINSURANCE COST • Reinsurance is a global industry, so the cost of hurricane reinsurance for most companies is unfortunately impacted by large catastrophes experienced around the world and by the current financial crisis. • Over the past 5 years the cost of this wind reinsurance had been rising, but recently it has stabilized and in some cases declined. But with the high cat losses of 2011 (quakes in Japan, New Zealand, Turkey; tornadoes and wildfires in the U.S.), it is not certain yet if reinsurance rates will rise soon.
TERRITORIAL RATE DIFFERENCES • So what causes rates to vary by territory? • Actual Fire, Water, Theft, Liability claims • Actual non-hurricane wind claims • Hurricane model estimates • Cost of reinsurance • Competition in more desirable (i.e. predictable) territories
HOMEOWNERS RATE FILINGS • Companies almost never file wind rates below the actuarially justified rates since there is a high risk that the actual wind/hurricane losses could be greater than those predicted by the models, and because of the cost of their reinsurance. • Companies are typically justifying rate increases in the 10% - 20% range due to higher losses, prior indicated increases that they did not request, inflation, and increases in hurricane model estimates. • The DOI has not been permitting any individual insured to receive more than a 35% increase at renewal, assuming no change in coverage.
HOMEOWNERS RATE FILING REVIEWS • Though Alabama Homeowners rates are very high on the coast, the DOI is scrutinizing every admitted company’s rates to make certain that they are statistically justified and that they will not generate excessive profits for the companies in the long run.
ALABAMA HOMEOWNERS RATES • 2007 NAIC DATA – AVG. PREMIUM PER POLICYBY STATE • HO-3 • COV. A = $175,000-199,000 • DATA EXCLUDES WIND POOLS, CITIZENS OF FL AND LA • DATA INCLUDES PRIVATE MARKET POLICIES BOTH INCLUDING AND EXCLUDING WIND
ALABAMA HOMEOWNERS RATES STATEPREMIUMINDEX TO ALSTATEPREMIUMINDEX TO AL CW $718 76% ID $397 42% AL 946 100% IL 597 63% AK 730 77% IN 650 69% AZ 573 61% IA 640 68% AR 832 88% KS 957 101% CA 656 69% KY 590 62% CO 693 73% LA 1,468 155% CT 653 69% ME 562 59% DE 466 49% MD 586 62% DC 768 81% MA 737 78% FL 1,365 144% MI 695 73% GA 661 70% MN 732 77% HI 534 56% MS 1,133 120% Gulf Coast – Averages 41% above AL Tornado Alley – Averages 5% below AL Eastern Seaboard – Averages 29% below AL
ALABAMA HOMEOWNERS RATES STATEPREMIUMINDEX TO ALSTATEPREMIUMINDEX TO AL MO $716 76% PA $607 64% MT 686 73% RI 737 78% NE 826 87% SC 779 82% NV 586 62% SD 691 73% NH 612 65% TN 726 77% NJ 576 61% TX 1,369 145% NM 641 68% UT 467 49% NY 624 66% VT 600 63% NC 635 67% VA 603 64% ND 854 90% WA 421 45% OH 529 56% WV 678 72% OK 1,162 123% WI 470 50% OR 440 47% WY 629 66% Gulf Coast Tornado Alley Eastern Seaboard
ALABAMA HOMEOWNERS RATES Average premium relativity for 3 large companies for a $200,000 home compared to Muscle Shoals, AL: Rome, GA = 78% Pittsburg, KS = 98% Russellville, AR = 99% Muscle Shoals, AL = 100% Beatrice, NE = 105% Farmersville, LA = 116% Walls, MS = 127% Joplin, MO = 129% Brownsville, TN = 135% Mt. Pleasant, TX = 164% Miami, OK = 171% Ft. Walton Beach, FL = 214%
ALABAMA HOMEOWNERS RATES Average Premium Relativity (with Wind) by City for a $200,000 Home: Birmingham (35242) = 100% Huntsville (35801) = 110% Montgomery (36117) = 111% Tuscaloosa (35401) = 120% Camden (36726) = 135% Gadsden (35901) = 136% Dothan (36301) = 139% Saraland (36571) = 263% Mobile (36608) = 294% Bay Minette (36507) = 300% Fairhope (36532) = 311% Gulf Shores (36542) = 328%