Download
1 / 56
560 likes | 655 Views
Modelling Needs and Resources of Older People to 2030 (NaROP2030). A collaborative research project funded by the Research Councils’ New Dynamics of Ageing programme. Thank you Ruth!. NDA Planning Meeting 13th December 2006. 10.00 Welcome and introductions

E N D
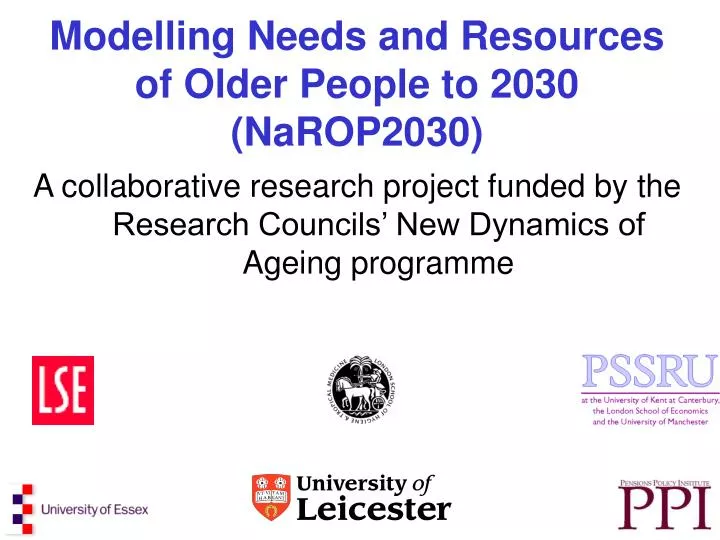
Modelling Needs and Resources of Older People to 2030 (NaROP2030) A collaborative research project funded by the Research Councils’ New Dynamics of Ageing programme
NDA Planning Meeting13th December 2006 10.00 Welcome and introductions Presentation of workpackages and initial discussion 1. WP1 – Mortality trends (MM) 2. WP2 – Future disease patterns (CJ) 3. WP3 – Changing family unit and kinship (EG&MM) 4. WP4 – Family support (EG) 5. WP5 – Pensions, incomes, savings and LTC (RH, CC&PSSRU) 12.30 – 1.30 Lunch 1. Further discussion about linkages between workpackages 2. Other issues: a. data and data management b. dissemination plans (+ website, logo) c. meetings of the team d. links to the wider NDA programme – feedback from conference e. advisory group f. seminar 3.30 Break for refreshments 4.00 Administrative issues (it is not essential that everyone attends this part of the meeting) a. budgets, etc b. AOB 5.30 Finish
Partners Academic London School of Economics (Dept of Social Policy, Personal Social Services Research Unit) University of Leicester (Dept of Health Sciences) London School of Hygiene & Tropical Medicine (Centre for Population Studies) University of Essex (Dept of Health & Human Sciences) Pensions Policy Institute Non-academic Department for Work and Pensions
Aims • To produce high quality analysis to inform public debate and development of future long-term care and pensions policy up to 2030 By • projecting the numbers, disability status, family circumstances, income, savings and care needs of older people, over the next 30 years • assessing the affordability and distribution of costs and benefits of combined policy options for pensions and long-term care • accounting for links between care needs and economic resources in later life
Methods • an integrated programme of new statistical analysis and modelling • building on pre-existing models • sensitivity testing to key trends • scenarios on key unknowns
The Team and Time Scale • Prof Mike Murphy, LSE • Profs Carol Jagger & James Lindesay, Leicester • Prof Emily Grundy, LSHTM • Prof Ruth Hancock, Essex • Raphael Wittenberg, Adelina Comas-Herrera, Linda Pickard, Derek King, Juliette Malley, PSSRU • Chris Curry, Adam Steventon, PPI • Department for Work and Pensions • BT Time scale: Jan 2007 - Dec 2009
Time Scale – Year 1 Months 1-6: Analysis of overall mortality trends, specification of LS data sets (WP1,3,4) Extension to gender-specific projections and disease scenarios (WP2) Acquisition of GHS, BHPS & vital registration data (WP3) Intital analyses of correlates of household composition (WP4) Initial ‘linking’ of PSSRU, CARESIM and PPI models (WP5) 7-12: Analysis of cause-specific mortality trends (WP1) Modelling different disability levels (WP2) Development of kinship model to incorporate new features (to month 16) (WP3) Specification and completion of work on household transitions (WP4) Analysis of the relationship between low income and receipt of long-term care; associations between kin availability and receipt of unpaid and paid care; provision of unpaid care by intensity; and transitions into and out of unpaid/paid care. (Months 6-18) (WP5)
Time Scale -Years 2&3 Months 13-15: Development of mortality scenarios in conjunction with other workpackages (WP1) Modelling of impact on funding for pensions and long-term care (Months 7-24) (WP5) Scenario development of overall kin availability trends (WP3) Analyses of ELSA data and completion of longitudinal analyses (Months 13-24) 16-20: Integration of mortality results into PSSRU model (WP1) Review of further disease scenarios and production of outputs for other models (WP2) Integration of overall kinship results into PSSRU model (WP3) Incorporation of findings from other workpackages, including mortality, disability and household formation into PSSRU, CARESIM and PPI modelling (Months 19-24) (WP5) 21-24: Analysis of LS data (WP1 & 3) Output of DFLE with different scenarios (WP2 to month 30) 25-30: Production of scenarios using PSSRU model; interpretation of results (WP1, 3,4) Updated scenario modelling (Months 25-30) (Wp5) 31-36: Report writing and dissemination (all WPs)
5 linked work packages Future disease patterns & their implications for disability in later life (WP2) Mortality trends and their implications (WP1) Changing family units & kinship structure (WP3) Projections of pensions, incomes, savings, care (paid & unpaid); expenditure on pensions & long-term care (WP5) Household & family resources (WP4)
Mortality trends and their implications (WP1) • modelling longevity trends and longevity scenarios (0.45 years) • + 1 year RO
Mortality trends and their implications (Murphy, LSE) To model overall patterns of mortality, including both cohort and period data using British official statistics available from 1841, Sweden (from 1750), Japan (from 1950) and France (from 1790). Model marital-status differences using a data-base for nine countries constructed for the EU-funded FELICIE programme (FELICIE, 2005). Use cause-specific information to assess the sensitivity of these results to assumptions about future prevalence and incidence of the key set of diseases, and in particular, how they may influence sex differentials in mortality, using data from Britain from 1900. In addition we will incorporate where relevant, information on a small number of major life-threatening diseases defined through WP 2. We will investigate mortality differentials by socio-demographic variables and assess how they may change in decades to come, linked to WP 3 & 5, building on our collaboration with colleagues in Finland & using the ONS Longitudinal Study.
Mortality trends & implications linkages Future disease patterns & their implications for disability in later life (WP2) Mortality trends and their implications (WP1) Changing family units & kinship structure (WP3) Projections of pensions, incomes, savings, care (paid & unpaid); expenditure on pensions & long-term care (WP5) Household & family resources (WP4)
Linkages • All other parts of the project depend on the projected number of older people, and will therefore use these results. • In some cases it is possible to model these in an integrated way (one example is diabetes, itself linked to obesity – a factor which can lead to major variations in both the health and mortality status of older people in years to come
Timescale • Macro-level starts immediately – results can be produced as required. • Cause-specific – probably await recruitment of RO – potentially starts in early 2008 • Marital status some aspects (eg cross-country) can start immediately • Analysis of micro data differentials will start later in year.
Linkages to Other Models • Data E&W due to availability of time series/LS etc. Some additional data may be available • Output data can be customised to user requirements, eg age, base year etc.
Outputs • Forecasts & cross-national analyses of mortality trends using a range of recently-developed statistical methods • Analysing the role of cause-specific mortality in a more integrated way than before, will elucidate processes by which cohort effects may work through particular diseases. • The work on socio-economic differentials will lead to an understanding of whether socio-economic differentials continue up to the highest ages, and, in particular, whether these differentials are changing over time, as we have found in the case of marital status.
Project-specific Inputs & Outputs • Mortality rates by sex, age and some variables e.g. marital status in period up to 2030. • Alternative scenarios depending on: • Internal assumptions • Requests from other WPs
Example of work area Are there ‘golden cohort’ generations?
Introduction In common with a number of other developed countries, mortality improvements in the United Kingdom exhibit strong patterns by year of birth or "cohort" (Willets, 1999 and Willets et al, 2004b). Financial aspects of longevity risk Stephen Richards & Gavin Jones
Role in forecasting The ‘golden cohort’ generations are currently dominating the old ages and raising the average rate of improvement. As these cohorts age, their influence on overall mortality measures will diminish. Hence, other things remaining equal, it might be expected that the overall rate of improvement would decline as these cohorts become very old.
The Questions • What are cohort effects? • What interpretation do they have? • How are they measured? • Who are the ‘Golden generations’ • What are the implications? • Men, women or both? • Future look
The conclusion “It will be seen that these contours show a remarkable tendency to follow the diagonals. … the figures along a diagonal represent the rates experienced by a particular group (or generation) of individuals all born in a particular yearperiod The general conclusion … would seem to be that … the relative mortality is approximately constant for each generation at all periods of life.” (p. 679)
Percentage improvements in age specific mortality rates comparing 5 year averages England and WalesMales Females National Statistics & GAD. National Statistics Quality Review Series Report No. 8: National Population Projections: Review of Methodology for Projecting Mortality (2001), (p50-1)
Kermack et al EW Males Perioddata from The Human Mortality DatabaseHMD (http://www.mortality.org)
Kermack et al EW FemalePerioddata from The Human Mortality DatabaseHMD (http://www.mortality.org)
England & Wales Male Kermack log(qx) Period excl 1914−20, 1940−45(spar=.8 D1)
England & Wales Female Kermack log(qx) Period excl 1914−20, 1940−45(spar=.8 D1)
Conclusions • Using information on period, cohort and age models, if extrapolated, lead to the finding that mortality improvements will cease very shortly (at all ages) – is this less justified than any other extrapolative model?
Conclusions (contd) • The existence of ‘real’ cohort effects that are (a) long-lasting, and (b) demographically important has not been clearly demonstrated (even in the most extreme conditions e.g. Dutch hunger Winter vs. Leningrad siege, & Finland 1869 famine) • The existence of ‘Golden generations’ has not been conclusively established (at least in respect of explicit criteria) • More multidisciplinary work is needed importance • Smoking may not be sufficient • The relationship of male and female patterns remains unclear
WP 3 Projections of the Changing Family Unit and Kinship Structure (Murphy, LSE, Grundy, LSHTM) projections of the older population by age, sex and kinship status (0.45 years) + 1 year RO • Kinship ties become more important with age, as kin form a major resource in times of need. • Having kin is a precondition for kin interaction and support, and cumulative lifetime experiences such as total number of partnerships substantially affect interactions with other kin.
WP 3 Projections of the Changing Family Unit and Kinship Structure • Kinship micro simulation models have principally been used to model total populations rather than sub-populations, largely because suitable sub-group specific transition rates do not exist. • We will therefore make some illustrative projections of population by educational level of people who left school before the 1960s. • This will use the two decades of fertility and partnership histories from the General Household Survey, which includes information on all cohorts from 1925 onwards, supplemented by earlier data for the 1992 BHPS retrospective history data.
family units & kinship structure linkages Future disease patterns & their implications for disability in later life (WP2) Mortality trends and their implications (WP1) Changing family units & kinship structure (WP3) Projections of pensions, incomes, savings, care (paid & unpaid); expenditure on pensions & long-term care (WP5) Household & family resources (WP4)
Introduction • Main demographic trends of 'first demographic transition' in now-developed societies: • fertility declined from a level of about five children per woman in 19th century to 'below-replacement level fertility' today • mortality has declined with e0 around 1900 of about 40 years but double that today • populations have aged with proportions aged 65 & over now around 20%.
Dependency Ratios, UK Pensions: Challenges and Choices. The First Report of the Pensions Commission. October 2004 (available at http://www.pensionscommission.org.uk/)
Introduction (contd) • Main demographic trends of 'second demographic transition' in now-developed societies: • substantial reductions in nuptiality • increases in non-marital cohabitation • more divorce • increases in the proportion of births outside marriage.
Impacts on: • those directly involved • national population structures • families and kin.
Kinship: the background • Kinship distribution is determined by the demographic parameters of fertility, mortality, nuptiality, divorce and cohabitation applied to the population for many decades prior to that time point • The contemporary pattern of kinship is also influenced by more recent trends, especially when step-kin are considered • Little information available in Britain (or elsewhere) on kinship in large nationally-representative data sources.
Special aspects of demographic kinship modelling • Not contemporary survey oriented • Technically more complex than e.g. household modelling (but data requirements simple c.f. policy microsimulation)
Method: demographic microsimulation using the Berkeley SOCSIM model • an initial population of size 100,000 with the population distribution of England in 1851 subject to appropriate rates of fertility, mortality and nuptiality (including divorce) for the period since 1851
SOCSIM demographic microsimulation model • initial population subject to appropriate rates of fertility, mortality and nuptiality, these individuals age month by month; some will marry (or cohabit) with each other, give birth, divorce or remarry, and finally they die • Monte Carlo method • model builds up kinship links for an initial population of unrelated and never-married people
Population distribution: comparison of model and survey data
Principal trends in family and kin structures: Partners • In the North Western European marriage pattern, historically marriage was relatively late and high proportions never married • marriage rates were particularly low in the 1920s and 1930s • in the period from 1945 to about 1970 many countries experienced an unprecedented marriage boom • recently, a substantial decline in marriage • cohabitation has increased, but insufficient to offset the decline in marriage.
Principal trends in family and kin structures: Children & Parents • fertility rates were particularly low in the 1920s and 1930s • in the period from 1945 to about 1970 many countries experienced an unprecedented fertility boom (a ‘golden age’?) • recently, a substantial decline in fertility, but increase in extra-marital (mainly cohabiting union) childbearing • Re-partnering has become more common, with effects on ‘incomplete families’