Download
1 / 92
920 likes | 1.16k Views
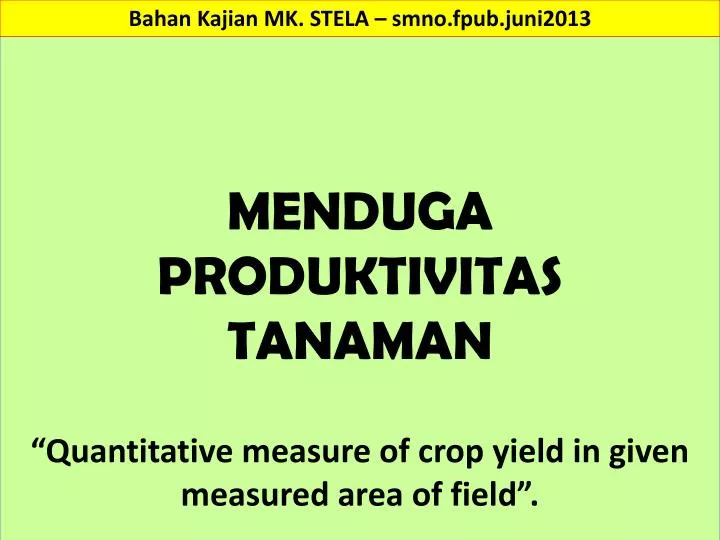
MENDUGA PRODUKTIVITAS TANAMAN “Quantitative measure of crop yield in given measured area of field”. Bahan Kajian MK. STELA – smno.fpub.juni2013. FACTORS AFFECTING PLANT GROWTH. Pertumbuhan. Pertumbuhan tanaman berhubungan dengan faktor-faktor yg mempengaruhinya .

E N D
MENDUGA PRODUKTIVITAS TANAMAN “Quantitative measure of crop yield in given measured area of field”. BahanKajian MK. STELA – smno.fpub.juni2013
FACTORS AFFECTING PLANT GROWTH Pertumbuhan Pertumbuhantanamanberhubungandenganfaktor-faktorygmempengaruhinya. G = f (X1, X2, X3 .....Xn) G = measure of growth Xi = growth factors The factors that affect plant growth can be classified as genetic or environmental. Waktu. time Sumber: http://broome.soil.ncsu.edu/ssc051/Lec3.htm
Mathematical Growth Functions EkspresiCROP Growth Analysis (CGA) biasanyamenunjukkanseperangkatmetodekuantitatifuntukmendeskripsikandanmenginterpretasikanperilakusistemtanamanpadakondisialamiah, semi-natural ataudalamlingkunganterkendali. Sumber: http://www.diprove.unimi.it/groups/agro_rg3.htm
KURVA RESPON TANAMAN Liebig (1860, German) (Linear): Y = mX + b dimana: Y = Hasiltanaman. m = slope - i.e. rate of yield increase. It is a function of the environment and nutrient. X = Jumlahhara (pupuk) yang ditambahkan. b = minimum yield, one would get this yield with no nutrient additions. Sumber: http://www.public.iastate.edu/~teloynac/354gcur.pdf
KURVA RESPON TANAMAN Mitscherlich (1910, German) (Law of Diminishing Returns) (1) ….. dy/dx = (A-Y)C Kalaupersamaan (1) diintegralkanmakadiperoleh: (2) ….. log (A-Y) = log(A) – cX dimana: A = maximum possible yield theoretical). Y = actual yield. dy/dx = slope - i.e. rate of yield increase. It is a function of the environment, the nutrient, and amount of nutrient already present. This value gets smaller as nutrient amount increases. x = Jumlahhara (pupuk) yang ditambahkan nutrient added. c = Konstante. Sumber: http://www.public.iastate.edu/~teloynac/354gcur.pdf
KURVA RESPON TANAMAN Bray (1920, U. Illinois) ... (soil interactions) Pengembangan Model dasarMitscherlichmenjadi: log (A-Y) = log(A) - c1B – cX dimana: A = Hasilmaksimum yang mungkin (teoretis). Y = Hasilaktual. dy/dx = slope - i.e. rate of yield increase. It is a function of the environment, the nutrient, and amount of nutrient already present. This value gets smaller as nutrient amount increases. X = amount of nutrient added. c1 = constant that is for B. c = constant. B = value explaining behavior of ‘immobile’ nutrients (e.g. K, P, Ca, Mg). The c1B term takes into account the reality that nutrients interact with soil and not all nutrients behave identically. Sumber: http://www.public.iastate.edu/~teloynac/354gcur.pdf
KURVA RESPON TANAMAN Baule (c. 1920, German mathematician, worked with Mitscherlich) (nutrient interactions) Baule developed idea of “half-way points.” Using the identical relationship as Mitscherlich, Baule concluded that Y = A - A(1/2) # BauleUnits dimana: A = Hasilmaksimumygmungkin (teoretis). Y = Hasiltanamanaktual. # Baule Unit = the amount of nutrient that when added results in moving Y (yield) one-half way closer to A (maximum possible yield). Practically, this equation says when one Baule Unit of a nutrient is added, then yield increases 50% of the difference between current yield and possible yield. If a second Baule Unit is added, then yield increase will be 1/2-way closer to the maximum possible yield, so 2 Baule Unites would result in 75% of the maximum possible yield increase. If a third Baule Unit of a nutrient is added, move 1/2-way closer to the maximum possible yield, or 87.5% of the maximum possible yield would result. Sumber: http://www.public.iastate.edu/~teloynac/354gcur.pdf
KURVA RESPON TANAMAN KURVA RESPON PERTUMBUHAN TANAMAN THE "LAW OF DIMINISHING RETURNS“ When all growth factors except one are adequately supplied, adding increments of the limiting growth factor will increase yields. One of the best known attempts to express growth curves mathematically was that of Mitscherlich. His equation predicts that each succeeding increment of growth factor (a plant nutrient, for example) will produce a smaller increment of growth than the preceding increment. The Mitscherlich yield response curve is an example of a well-known concept in economic theory-the law of diminishing returns. The equation has the form dy/ dx = (A-y)C where dy is yield increase from an increment of growth factor dx, A is maximum yield attainable as the result of adding an unlimited amount of growth factor, y is the yield obtained after any given quantity of the factor x has been applied, and C is a proportionality constant. Actual yield response curves always pass through a maximum; and, excess nutrient depresses yield. Sometimes initial increments of added nutrient are so immobilized by the soil or utilized by soil organisms or weeds that they increase growth less than later increments. Sumber: http://www.ctahr.hawaii.edu/oc/freepubs/pdf/IC-002.pdf
KURVA RESPON TANAMAN ILLUSTRATED CONCEPTS IN TROPICAL AGRICULTURE A series prepared by the Department ofAgronomy and Soil Science College of Tropical Agriculture University ofHawaii GROWTH RESPONSE CURVES-THE "LAW OF DIMINISHING RETURNS“ HASIL TANAMAN DOSIS PUPUK Sumber: http://www.ctahr.hawaii.edu/oc/freepubs/pdf/IC-002.pdf
Crop Forecasting by using Crop-Yield Weather Regression Model M. RezaulKarimTalukder & M. SayedurRahman. MODEL REGRESI TANAMAN-IKLIM Regression analysis is a statistical technique for investigating and modelling the relationship between variables. Applications of regression are numerous and occur in almost every field, including food management, engineering, the physical sciences, economics, life and biological sciences, and the social sciences. In fact, regression analysis may be the most widely used statistical technique. Model regresiygmelibatkanlebihdarisatuvariabelbebasdisebut “multiple regression model”. Sumber: www.nfpcsp.org/.../Workshop_on_Regression_Model_Hand_Note_0.do...
Crop Forecasting by using Crop-Yield Weather Regression Model M. RezaulKarimTalukder & M. SayedurRahman. Model regresitanaman-iklim: m n Yi = i+ ijWj+ ikIk+ ui j=1 k=1 Where Yi is the yield of the ith crop, Wj is the jth agro-climatic variable in the production of the ith crop, Ik is the kth input variable in the production of the ith crop, j and k are the coefficient of the relevant variable, o is the constant and ui is the disturbance term. For a particular crop, the explicit form of the equation will be determined by the variables relevant for the crop. In the present exercise, the full model contained ten regressors, which were to explain the yield of Boro rice for the 2001-02 season. Sumber: www.nfpcsp.org/.../Workshop_on_Regression_Model_Hand_Note_0.do...
Crop Forecasting by using Crop-Yield Weather Regression Model M. RezaulKarimTalukder & M. SayedurRahman. Formula model regresi linear berganda: Y = o + 1 MXT + 2 MNT + 3 AVT + 4 DTR + 5 TRF + 6 CRF + 7 NSR + PR + FERT + TIME + e dimana: Y= Yield of Boro rice (Mt/ha). MXT= Maximum temperature (0c); MNT= Minimum temperature (0c); AVT= Average temperature (0c); DTR= Diurnal temperature range (0c); TRF= Total rainfall of the week (mm); CRF= Cumulative rainfall for the season up to the week (mm); NSR= Net solar radiation (cal/cm2/day); PR = Price value (Tk. per quintal) ; FERT = Fertilizer (‘000 Mt.); TIME= Year; e= Stochastic term/ residual term / error term. Sumber: www.nfpcsp.org/.../Workshop_on_Regression_Model_Hand_Note_0.do...
FACTORS AFFECTING PLANT GROWTH FAKTOR GENETIK 1. Field crops - Yield potential is determined by genes of the plant. A large part of the increase in yield over the years has been due to hybrids and improved varieties. Other characteristics such as quality, disease resistance, drought hardiness are determined by the genetic makeup. Corn hybrids are an example of a dramatic yielincease resulting from genetics. Genetic engineering is now becoming an important tool in changing a plants potential. Nursery crops and turf - not interested in total growth as much as appearance. Ex. is Bermudagrass Variety and Plant Nutrient needs-Hybrid corn producing 200 bu/ac requires more plant nutrients than a hybrid producing 100 bu/ac. As potential crop yields are increased, the plant nutrients required are increased. Current research in the Soil Science and Genetics department is concerned with developing corn hybrids that use nitrogen more efficiently - Produce more grain per pound of N - fertilizer. 4. A producer has control over the genetic factor by his choice of variety. Field crops - highest yielding, disease resistant, etc. Nursery - Best appearance - dwarf vs larger shrubs Sumber: http://broome.soil.ncsu.edu/ssc051/Lec3.htm
FACTORS AFFECTING PLANT GROWTH FAKTOR LINGKUNGAN All external conditions and influences affecting the life and development of an organism. The following are regarded as the most important environmental factors Temperatur Suplai Air Energiradiasimatahari Komposisiatmosfir Soil aeration and soil structure Kemasamantanah = Soil reaction Faktorbiotik Supply of mineral nutrients Absence of growth-restricting substances Sumber: http://broome.soil.ncsu.edu/ssc051/Lec3.htm
FACTORS AFFECTING PLANT GROWTH Temperature A measure of the intensity of heat. Plant growth occurs in a fairly narrow range - 60 - 100 degrees F 1. TemperaturSecaralangsungmempengaruji: FOTOSINTESIS RESPIRASI TRANSPIRASI - loss of water PENYERAPAN AIR DAN HARA DARI TANAH. 2. The rate of these processes increases with an increase in temperature responses are different with different crops cotton vs collards or potatoes fescue vsbermuda grass. These generalizations hold within a crops range of adaptation 3. Temperature also affects soil organisms nitrifying bacteria inhibited by low temperature. pH may decrease in summer due to activities of microorganisms 4. Temperaturtanahmempengaruhipenyerapan air danhara Sumber: http://broome.soil.ncsu.edu/ssc051/Lec3.htm
FACTORS AFFECTING PLANT GROWTH AERASI TANAH Compact soils of high bulk density and poor structure are aerated poorly. Pore space is occupied by air and water so the amount of air and water are inversely proportional to the amount of oxygen in the soil. On well drained soils, oxygen content is not likely to be limiting to plant growth. Plants vary widely in their sensitivity to soil oxygen. Paddy rice vs tobacco Sumber: http://broome.soil.ncsu.edu/ssc051/Lec3.htm
FACTORS AFFECTING PLANT GROWTH KEMASAMAN TANAH = Soil reaction pH influences availability of certain nutrients ex phosphate availability low on acid soils. Al is toxic to plants diseases affected by pH Potato scab controlled by keeping pH below 5.5 Sumber: http://broome.soil.ncsu.edu/ssc051/Lec3.htm
FACTORS AFFECTING PLANT GROWTH SUPLAI AIR Plant growth restricted by low and high levels of soil moisture : 1. can be regulated with drainage and irrigation 2. good soil moisture improves nutrient uptake If moisture is a limiting factor fertilizer is not used efficiently. Sumber: http://broome.soil.ncsu.edu/ssc051/Lec3.htm
Hubunganantarastabilitasstruktur (agregat) tanahdneganhasiltanaman pd berbagaiperlakuanolahtanah (TDD = triple disc drill ; SC/TDD = scarify and triple disc drill ; DDC = direct drill with combine ; DP = district practice - cultivate and seed with combine Sumber: http://www.agric.wa.gov.au/PC_92448.html
HUBUNGAN DOSIS PUPUK DG HASIL TANAMAN Sumber: http://www.smart-fertilizer.com/fertilizer-application-rates
FAKTOR PEMBATAS HASIL TANAMAN Sumber: http://www.smart-fertilizer.com/fertilizer-application-rates
DOSIS PUPUK untuk HASIL OPTIMUM-EKONOMIS A yield goal is the yield you hope to harvest. In order to be profitable, it is very important that you set a yield goal that is realistic and achievable and that you use the right tools and practices to achieve that goal. KEUNTUNGAN KERUGIAN Sumber: http://www.smart-fertilizer.com/fertilizer-application-rates
A Typical Nitrogen Response Curve Hasilmaksimum Maximum yield (C) is reached at a nitrogen rate greater than the on-farm economic optimum and this is never a target if farm profits are to be maximised. Application of nitrogen above point C does not increase yield, and with further applications yield falls and the need for agro-chemicals such as fungicides and growth regulators may increase. Dosispupuk optimum ekonomis on-farm Sumber: http://adlib.everysite.co.uk/adlib/defra/content.aspx?doc=262994&id=263054
KURVA RESPON PUPUK NITROGEN A typical N response curve (orange line) versus a response curve for a 'workhorse' hybrid (blue line). The response curve for a workhorse hybrid has a higher check plot yield (yield at 0 lb N/acre) and an above average response to 60 lb N/acre. Sumber: http://cropphysiology.cropsci.illinois.edu/research/MYP.html
MENDUGA PRODUKTIVITAS TANAMAN Penelitian DILAKUKAN untukmemprediksihasiljagungdankedelaisebagaiindeksproduktivitastanah-tanahdi Illinois , keduatanamaninimeliputi 90% darikeseluruhanlahanpertanian yang ada. Model regresibergandadigunakanuntukevaluasihubunganantara 16 sifattanahygterpilihdari 34 tipetanah-utamadenganhasiljagungdankedelai yang telahditetapkan (data sekunder) periode 1970-an (1967±1976). Statistical models developed from major soils were tested internally by calculating the 10-year average corn and soybean yields for each of the 34 major soils. The coefcients generated from multiple regression were further tested using the soil property values for the additional 165 soils identi®ed in nine counties representing the crop reporting districts and weather districts in Illinois. Sumber: Predicting corn and soybean productivity for Illinois soils. J.D. Garcia-Paredes, K.R. Olson , J.M. Lang. Agricultural Systems 64 (2000) 151±170
MENDUGA PRODUKTIVITAS TANAMAN Crop yields are the result of environmental factors such as soil, climate, and management inputs. The e€ect of technology and management on crop yield is determined, in part, by the type of soil. Consequently more specific information on the influence of soil properties on crop yields is required. Banyakpakarmencobamenemukanhubunganantarasifat-sifattanah, iklim, hasiltanaman, dantanah-tanah , kemudianmembandingkannya. Banyakpenelitianagronomismembuktikanbahwa “kedalamantanah” sangatmenentukanhasiltanaman, secaralangsungdantidaklangsung. Banyaksifat-sifattanahygdianggapsangatmnenentukanhasiltanaman , ternyataberhubungandengankemampuantanahmenyimpan air (WHC - Water holding capacity). Sumber: Predicting corn and soybean productivity for Illinois soils. J.D. Garcia-Paredes, K.R. Olson , J.M. Lang. Agricultural Systems 64 (2000) 151±170
MENDUGA PRODUKTIVITAS TANAMAN PerbedaanhasiltanamandanproduktivitastanahdapatdicerminkandalambentukIndeksProduktivitas. Productivity ratings are a good indicator of the suitability of soils for crop production. They are useful in determining optimum soil management and use. Accurate and reliable soil productivity information is desired for crop yield estimates and productivity indices of each soil type to complement land appraisal and use management. Data sekundertentangproduktivitastanamanmasalaludapatdikoreksidenganpenyesuaiannumeriksesuaidneganperkembanganteknologitanaman. Sumber: Predicting corn and soybean productivity for Illinois soils. J.D. Garcia-Paredes, K.R. Olson , J.M. Lang. Agricultural Systems 64 (2000) 151±170
MENDUGA PRODUKTIVITAS TANAMAN Hasiltanamanmeningkatsecarasignifikandidaerah Illinois USA selamaperiode 1945 hingga 1995. Peningkatanhasiltanamaniniternyatadisebabkanolehperbaikanteknologitanaman (Swanson et al., 1977) yang meliputi: Input kimia-biologissepertijenisunggul, pupuk mineral, pestisida, danpopulasitanaman yang lebihtinggi. Sumberdayamekanik, ALSINTAN Pengelolaan. Along with augmented crop yield trend, there were annual fluctuations from weather effects. Swanson, E.R., Smith, D.G., Nyankori, J.C., 1977. Have corn and soybean yields reached a plateau? Series E, Agricultural Economics No 77, E-17. Sumber: Predicting corn and soybean productivity for Illinois soils. J.D. Garcia-Paredes, K.R. Olson , J.M. Lang. Agricultural Systems 64 (2000) 151±170
MENDUGA PRODUKTIVITAS TANAMAN Trends in crop yields are important for economic decision makers, as well as for farm owners and operators because yield performance may influence determinations regarding agricultural inputs levels and adoption of new technologies. Additionally, past, present and future crop yield data could be used as a basis for land valuation (assessment), crop insurance, and other related farm business. Sumber: Predicting corn and soybean productivity for Illinois soils. J.D. Garcia-Paredes, K.R. Olson , J.M. Lang. Agricultural Systems 64 (2000) 151±170
MENDUGA PRODUKTIVITAS TANAMAN Kecenderunganhasiltanamanmenjadisalahsatu issue pentingdalampembangunanpertanian. Berbagaikajiandilakukanuntukanalisiskecenderunganhasiltanamandanmeramalkanprospekmasadepannya. Many of these studies were focused at or within a state level. Greater yield increments were identified in the previous 5-year period compared to the latter period. Sumber: Predicting corn and soybean productivity for Illinois soils. J.D. Garcia-Paredes, K.R. Olson , J.M. Lang. Agricultural Systems 64 (2000) 151±170
MENDUGA PRODUKTIVITAS TANAMAN The overall objective of this study was to update the corn and soybean yields which serve as a productivity index for Illinois soils since these crops are grown on 90% of the cropland. An approach based on multiple regression was used to evaluate the relationship between 16 selected soil properties of major soils and established corn and soybean yields. Sumber: Predicting corn and soybean productivity for Illinois soils. J.D. Garcia-Paredes, K.R. Olson , J.M. Lang. Agricultural Systems 64 (2000) 151±170
MENDUGA PRODUKTIVITAS TANAMAN ProsedurAnalisis Tahapananalisisnyaadalah: To develop crop yield-soil property models by stepwise multiple regression with 1970s crop yields along with soil properties from 34 major (base and benchmark) soils; To internally check by calculating average corn and soybean yields using the model generated coecients and the soil properties values for each of the 34 major soils; To test coeficients generated from multiple regression using the soil property values for an additional 165 soils identified in nine counties representing the crop reporting districts and weather districts in Illinois; Mengidentifikasi data “pencilan” hasiljagungdankedelai (lebihdari 2 simpanganbaku.) Sumber: Predicting corn and soybean productivity for Illinois soils. J.D. Garcia-Paredes, K.R. Olson , J.M. Lang. Agricultural Systems 64 (2000) 151±170
MENDUGA PRODUKTIVITAS TANAMAN ProsedurAnalisis Menentukanalasanterjadinyapencilan data danmengusulkanperbaikan model prediktif. Menentukanbesarnyaperubahanhasiljagungdankedelai yang dilaporkanpetaniselamaperiodewaktutertentu (1976 – 1995) diberbagaidaerahsentraproduksi; To use the 20-year crop regional yield increases to predict 1990s crop yields for 199 soils in nine northern and southern Illinois counties; To evaluate the model predicted plus 20-year trend increased crop yields and established plus 20-year trend increased crop yields for nine selected test counties by comparing with the 1990s farmer reported county crop production. Sumber: Predicting corn and soybean productivity for Illinois soils. J.D. Garcia-Paredes, K.R. Olson , J.M. Lang. Agricultural Systems 64 (2000) 151±170
MENDUGA PRODUKTIVITAS TANAMAN PEMILIHAN TIPE TANAH Thirty-four major soil types were chosen for a model development to determine crop yield estimates. These included nine base soils which were selected to represent the best producing soils under basic management which were assigned the highest basic productivity indices (Pis). Each of these soils have extensive acreage in Illinois. From various soil survey and soil conservation programs, it was determined that a list of 30 benchmark soils represented most of the major soil conditions in the state. Hasilpenelitianmenemukan lima tipeutamatanahdandisarankandigunakansebagaidasaruntukmengembangkan model hubunganhasiltanamandnegansifattanah. Sumber: Predicting corn and soybean productivity for Illinois soils. J.D. Garcia-Paredes, K.R. Olson , J.M. Lang. Agricultural Systems 64 (2000) 151±170
MENDUGA PRODUKTIVITAS TANAMAN PEMILIHAN TIPE TANAH Sejumlahsifatfisikadankimiatanah yang mempengaruhihasiltanamandapatdiidentifikasidneganbantuan model regresi linear berganda, yaitu: 1. Tebalnyalapisanpermukaan (topsoil) (cm); 11. % debupada topsoil; 2. % BOT pada topsoil; 12. KTK pada topsoil; 3. Depth (cm) to redoxamorphic (wetness) features drainage class (relates to drainage class); 13. Subsoil thickness (cm); 4. Plant available water to a depth of 150 cm; 5. Rooting depth as a function of soil structure (cm); 6. Depth in cm to 2nd parent material (usually thickness of loess); 7. Permeability; 14. Nilai pH topsoil ; 8. Subsoil pH; 15. Nilai BI topsoil; 9. Nilai BI subsoil; 16. Kejenuhan Na topsoil; 10. % liatpada subsoil. Sumber: Predicting corn and soybean productivity for Illinois soils. J.D. Garcia-Paredes, K.R. Olson , J.M. Lang. Agricultural Systems 64 (2000) 151±170
MENDUGA PRODUKTIVITAS TANAMAN AnalisisRegresiHasilTanaman Stepwise multiple regression was implemented to establish the relationship between 10-year crop yield estimates and selected soil property values. Sifat-sifattanahdinyatakandalambentuk “nilainumerik” untuksetiapkarakteristiktanah. Hanyasatunilaiditetapkanolehtipetanahatausifattanahpadahorison A, horison B atauprofiltanah. Sumber: Predicting corn and soybean productivity for Illinois soils. J.D. Garcia-Paredes, K.R. Olson , J.M. Lang. Agricultural Systems 64 (2000) 151±170
MENDUGA PRODUKTIVITAS TANAMAN STATISTICAL ANALYSIS Analisiskorelasidigunakannuntukmemberikaninformasittgsifatpeubahygdipakaidlm model regresiberganda, danuntukmengidentifikasipeubah-peubahmanaygkorelasinyalebihkuat. Simple statistical data analyses were evaluated (stemleaf diagrams, box plot, and normal probability plot) in order to check the usual assumption in regression analysis. The diagrams for most of the predictor variables were acceptable bell-shaped curves. The variable exchangeable sodium was not a bell-shaped curve, since all but one of the soils had values of zero. The Statistical Analysis System (SAS) was applied to analyze the soil and yield data. The R-square option was utilized with emphasis on maximizing R for regression. Sumber: Predicting corn and soybean productivity for Illinois soils. J.D. Garcia-Paredes, K.R. Olson , J.M. Lang. Agricultural Systems 64 (2000) 151±170
MENDUGA PRODUKTIVITAS TANAMAN Analisisregresi linear bergandadipakaiuntukmeng-estimasihubunganantarahasiltanamandanpeubah-peubahsifat-tanah. Perhitungandilakukandnegan model: Yi = β0 + β1X1 + β 2X2 ...... βiXi + εi .............. (1) where Yi is the response or dependent variable, which represents the predicted crop yields. The explanatory factors X1, X2, . . . Xi are assumed to be independent. i is the error due to the fact that the postulated independent variables do not completely account for the variation in Y. The parameter b0, b1 . . . bi are the population regression coecients for the soil effects. Sumber: Predicting corn and soybean productivity for Illinois soils. J.D. Garcia-Paredes, K.R. Olson , J.M. Lang. Agricultural Systems 64 (2000) 151±170
MENDUGA PRODUKTIVITAS TANAMAN Model sifattanahygdikembangkandaritanah-tanahutama, diujidenganmenghitungrataanhasiltanamanpadasemuatanahpertaniandidaerahsentraproduksitanaman. The predicted crop yields were compared to the established yield estimates for each crop, and to the farmer reported crop yields in IAS. The coeficients generated by multiple regression in the models were used with the soil property values for 165 additional soils found in the nine counties. These were not included in the original 34 major (base and benchmark) soils list. The sign and magnitude of the coeficients generated in the multiple regression models did not establish the absolute relationship between specific soil properties and crop yields since the variables were not completely independent and since multi-collinearity did not exist between some soil variables. Sumber: Predicting corn and soybean productivity for Illinois soils. J.D. Garcia-Paredes, K.R. Olson , J.M. Lang. Agricultural Systems 64 (2000) 151±170
MENDUGA PRODUKTIVITAS TANAMAN Teknikregresidipakaiuntukmeng-evaluasihubunganantaratahundanhasiljagungdankedelai. Pendekatanpertamadipakaiuntukanalisis data hasiltanamanuntuksemualokasi, danpendekatankeduauntukmenganalisisduajenistanahdisuatudaerahsurvei. Data hasiltanaman (data sekunder) dianalisisuntukduaperiodewaktu yang berbeda, misalnyaperiode 1945 - 1995, danperiode 1976 - 1995. Yield trend was measured using the least squares method which employed the following trend equation: Y = a + bx where Y, predicted value of Y based on the selected year; a, estimated value of Y where X=0; b, average change in Y for each change in year. Sumber: Predicting corn and soybean productivity for Illinois soils. J.D. Garcia-Paredes, K.R. Olson , J.M. Lang. Agricultural Systems 64 (2000) 151±170
MENDUGA PRODUKTIVITAS TANAMAN KORELASI ANTARA HASIL TANAMAN DAN NILAI SIFAT-SIFAT TANAH Secaraumumvariabel (sifattanah) bahanorganik (OM), available water (AvW), bulk density horison AE (DbAE), dan bulk density horison B (DbB), Tebalnyahorison AE (ThAE); Kapasitastukarkation (KTK) dan pH horison AE (pHAE) secarasignifikanberkorelasidenganhasiljagungdankedelai. Sumber: Predicting corn and soybean productivity for Illinois soils. J.D. Garcia-Paredes, K.R. Olson , J.M. Lang. Agricultural Systems 64 (2000) 151±170
MENDUGA PRODUKTIVITAS TANAMAN Table 2. Simple statistics for response and predictor variables for major soils Sumber: Predicting corn and soybean productivity for Illinois soils. J.D. Garcia-Paredes, K.R. Olson , J.M. Lang. Agricultural Systems 64 (2000) 151±170
MENDUGA PRODUKTIVITAS TANAMAN Korelasi paling kuatditemukanantarakandungan BOT dan KTK tanah. Air tersedia, pH dan BI darihorison AE danhorison B jugaberkorelasidnegankandungan BOT. Other significant correlations were observed between available water and thickness of AE horizons. High correlations between paired variables, such as organic matter and cation exchange capacity, silt of AE horizons and available water, explain, in part, why cation exchange capacity and available water were not selected in the reduced models. Sumber: Predicting corn and soybean productivity for Illinois soils. J.D. Garcia-Paredes, K.R. Olson , J.M. Lang. Agricultural Systems 64 (2000) 151±170
MENDUGA PRODUKTIVITAS TANAMAN SeleksiPeubahdanAnalisisRegresi Model sifattanah yang diperolehdalampenelitianbiasanyaberdasarkanpadaresponhasiltanaman (jagungdankedelai) terhadapkarakteristikfisikadankimiatanah. Most of these soil types occur in only the northern (including central) or southern region. Therefore, the influence of climate had been considered on a regional basis. Sumber: Predicting corn and soybean productivity for Illinois soils. J.D. Garcia-Paredes, K.R. Olson , J.M. Lang. Agricultural Systems 64 (2000) 151±170
MENDUGA PRODUKTIVITAS TANAMAN AnalisisRegresiHasilTanaman Model regresidigunakanuntukmengidentifikasipentingnyasifat-sifattanah yang terpilihuntukmemprediksihasiltanaman. Prosedurnyaadalahsbb: Analisisregresipendahuluandilakukan dg mengadoksiprosedurpemilihanvariabel Cp , untukmengidentifikasivariabelyg paling mempengaruhihasiltanaman, dankemudianmemilihtiga model regresiterbaikberdasarkanstatistik Cp Mallow. Prosedurpemilihan Cp menghasilkan n perangkat model ygdianggapoptimeummenurutkriteria Cp. Model-model inikemudiandiujidenganmemprediksihasiltanamanberdasarkansifat-sifattanahdari 34 tipetanahygdipilih. Sumber: Predicting corn and soybean productivity for Illinois soils. J.D. Garcia-Paredes, K.R. Olson , J.M. Lang. Agricultural Systems 64 (2000) 151±170
MENDUGA PRODUKTIVITAS TANAMAN Model regresibergandaygterbaikantarasifat-sifattanahdankoefisien-koefisiennyabagisetiaptanamandisajikandalamTabel 3. Persamaaninimencerminkan model regresibergandayg paling signifikanberdasarkannilaikoefisiendeterminasinya R2. Tanamanjagungdankedelaidipengaruhiolehbeberapasifattanah yang menghasilkanpersamaan model yang distingtif. Tabel 3. Model Regresisifat-sifattanahdenganhasiljagungdankedelaipadakondisitingkatpengelolaan rata-rata 1970-an (1967±1976) Sumber: Predicting corn and soybean productivity for Illinois soils. J.D. Garcia-Paredes, K.R. Olson , J.M. Lang. Agricultural Systems 64 (2000) 151±170
MENDUGA PRODUKTIVITAS TANAMAN BI horison B dan Na-tukarternyatasangatberkorelasidenganhasiltanaman, dankeduapeubahsifat-tanahinimunculdalam model regresihasiltanaman. Clay content of the B horizon was a non-significant correlated variable with crop yields, however, it was an important parameter in determining variations within both models. Kedalaman zone perakarandankedalamanbahaninduktanahtidakberkorelasidenganhasiltanaman. Sumber: Predicting corn and soybean productivity for Illinois soils. J.D. Garcia-Paredes, K.R. Olson , J.M. Lang. Agricultural Systems 64 (2000) 151±170
MENDUGA PRODUKTIVITAS TANAMAN Prediksihasiltanamandenganmenggunakan model regresisifat-sifattanahmempunyainilai R2 (koefdeterminasi) ygtinggikalaudibandingkan (diuji) dengannilai-nilaihasiltanamandari data sekunder. Untuktipe-tipetanah yang dianalisis, ternyatapersentasevariasihasiljagungdankedelai yang dapatdijelaskanoleh model regresisebesar 90% (Figs. 2 and 3). Sumber: Predicting corn and soybean productivity for Illinois soils. J.D. Garcia-Paredes, K.R. Olson , J.M. Lang. Agricultural Systems 64 (2000) 151±170
MENDUGA PRODUKTIVITAS TANAMAN Nilaihasiljagungtahun 1970-an (1967±1976) dari data sekunder dannilaiprediksihasiljagung (menggunakan model) untuk 34 tipetanahdi Illinois. Sumber: Predicting corn and soybean productivity for Illinois soils. J.D. Garcia-Paredes, K.R. Olson , J.M. Lang. Agricultural Systems 64 (2000) 151±170
MENDUGA PRODUKTIVITAS TANAMAN Nilaihasilkedelaitahun 1970-an (1967±1976) dari data sekunder dannilaiprediksihasilkedelai (menggunakan model) untuk 34 tipetanahdi Illinois. Sumber: Predicting corn and soybean productivity for Illinois soils. J.D. Garcia-Paredes, K.R. Olson , J.M. Lang. Agricultural Systems 64 (2000) 151±170