Download
1 / 1
10 likes | 205 Views
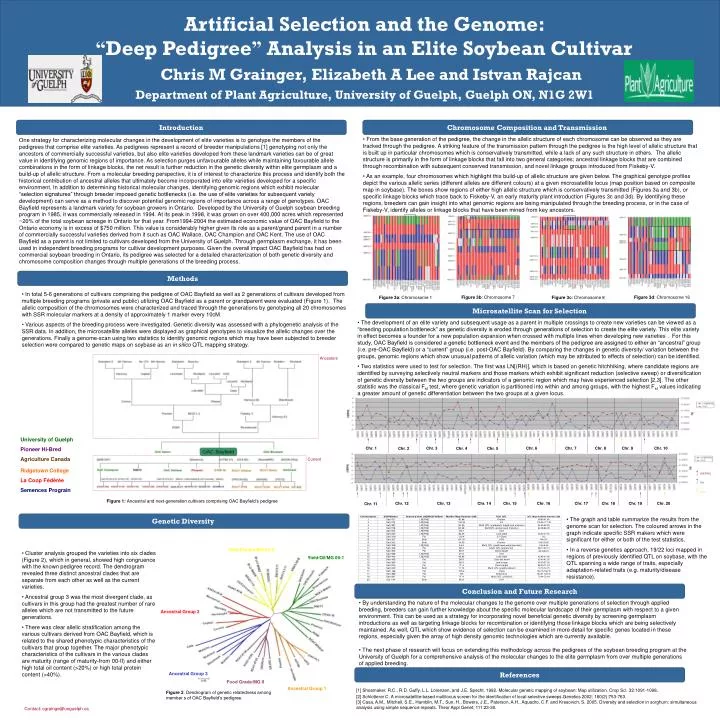
Artificial Selection and the Genome: “ Deep Pedigree ” Analysis in an Elite Soybean Cultivar. Chris M Grainger, Elizabeth A Lee and Istvan Rajcan. Department of Plant Agriculture, University of Guelph, Guelph ON, N1G 2W1.

E N D
Artificial Selection and the Genome: “Deep Pedigree” Analysis in an Elite Soybean Cultivar Chris M Grainger, Elizabeth A Lee and Istvan Rajcan Department of Plant Agriculture, University of Guelph, Guelph ON, N1G 2W1 Introduction Chromosome Composition and Transmission • From the base generation of the pedigree, the change in the allelic structure of each chromosome can be observed as they are tracked through the pedigree. A striking feature of the transmission pattern through the pedigree is the high level of allelic structure that is built up in particular chromosomes which is conservatively transmitted, while a lack of any such structure in others. The allelic structure is primarily in the form of linkage blocks that fall into two general categories; ancestral linkage blocks that are combined through recombination with subsequent conserved transmission, and novel linkage groups introduced from Fiskeby-V. • As an example, four chromosomes which highlight this build-up of allelic structure are given below. The graphical genotype profiles depict the various allelic series (different alleles are different colours) at a given microsatellite locus (map position based on composite map in soybase). The boxes show regions of either high allelic structure which is conservatively transmitted (Figures 3a and 3b), or specific linkage blocks which trace back to Fiskeby-V, an early maturity plant introduction (Figures 3c and 3d). By identifying these regions, breeders can gain insight into what genomic regions are being manipulated through the breeding process, or in the case of Fiskeby-V, identify alleles or linkage blocks that have been mined from key ancestors. One strategy for characterizing molecular changes in the development of elite varieties is to genotype the members of the pedigrees that comprise elite varieties. As pedigrees represent a record of breeder manipulations [1] genotyping not only the ancestors of commercially successful varieties, but also elite varieties developed from these landmark varieties can be of great value in identifying genomic regions of importance. As selection purges unfavourable alleles while maintaining favourable allele combinations in the form of linkage blocks, the net result is further reduction in the genetic diversity within elite germplasm and a build-up of allelic structure. From a molecular breeding perspective, it is of interest to characterize this process and identify both the historical contribution of ancestral alleles that ultimately become incorporated into elite varieties developed for a specific environment. In addition to determining historical molecular changes, identifying genomic regions which exhibit molecular “selection signatures” through breeder imposed genetic bottlenecks (i.e. the use of elite varieties for subsequent variety development) can serve as a method to discover potential genomic regions of importance across a range of genotypes. OAC Bayfield represents a landmark variety for soybean growers in Ontario. Developed by the University of Guelph soybean breeding program in 1985, it was commercially released in 1994. At its peak in 1998, it was grown on over 400,000 acres which represented ~20% of the total soybean acreage in Ontario for that year. From1994-2004 the estimated economic value of OAC Bayfield to the Ontario economy is in excess of $750 million. This value is considerably higher given its role as a parent/grand parent in a number of commercially successful varieties derived from it such as OAC Wallace, OAC Champion and OAC Kent. The use of OAC Bayfield as a parent is not limited to cultivars developed from the University of Guelph. Through germplasm exchange, it has been used in independent breeding programs for cultivar development purposes. Given the overall impact OAC Bayfield has had on commercial soybean breeding in Ontario, its pedigree was selected for a detailed characterization of both genetic diversity and chromosome composition changes through multiple generations of the breeding process. Methods • In total 5-6 generations of cultivars comprising the pedigree of OAC Bayfield as well as 2 generations of cultivars developed from multiple breeding programs (private and public) utilizing OAC Bayfield as a parent or grandparent were evaluated (Figure 1). The allelic composition of the chromosomes were characterized and traced through the generations by genotyping all 20 chromosomes with SSR molecular markers at a density of approximately 1 marker every 10cM. • Various aspects of the breeding process were investigated. Genetic diversity was assessed with a phylogenetic analysis of the SSR data. In addition, the microsatellite alleles were displayed as graphical genotypes to visualize the allelic changes over the generations. Finally a genome-scan using two statistics to identify genomic regions which may have been subjected to breeder selection were compared to genetic maps on soybase as an in silico QTL mapping strategy. Figure 3b: Chromosome 7 Figure 3d: Chromosome 16 Figure 3a: Chromosome 1 Figure 3c: Chromosome 8 Microsatellite Scan for Selection • The development of an elite variety and subsequent usage as a parent in multiple crossings to create new varieties can be viewed as a “breeding population bottleneck” as genetic diversity is eroded through generations of selection to create the elite variety. This elite variety in effect becomes a founder for a new population expansion when crossed with multiple lines when developing new varieties. For this study, OAC Bayfield is considered a genetic bottleneck event and the members of the pedigree are assigned to either an “ancestral” group (i.e. pre-OAC Bayfield) or a “current” group (i.e. post-OAC Bayfield). By comparing the changes in genetic diversity/ variation between the groups, genomic regions which show unusual patterns of allelic variation (which may be attributed to effects of selection) can be identified. • Two statistics were used to test for selection. The first was LN[(RH)], which is based on genetic hitchhiking, where candidate regions are identified by surveying selectively neutral markers and those markers which exhibit significant reduction (selective sweep) or diversification of genetic diversity between the two groups are indicators of a genomic region which may have experienced selection [2,3]. The other statistic was the classical Fst test, where genetic variation is partitioned into within and among groups, with the highest Fst values indicating a greater amount of genetic differentiation between the two groups at a given locus. Ancestors University of Guelph Pioneer Hi-Bred Agriculture Canada Chr. 1 Chr. 3 Chr. 6 Chr. 7 Chr. 8 Chr. 9 Chr. 10 Chr. 2 Chr. 4 Chr. 5 Current Ridgetown College La Coop Fédérée Semences Prograin LN[(RH)] Fst Both Figure 1: Ancestral and next-generation cultivars comprising OAC Bayfield’s pedigree Chr. 12 Chr. 13 Chr. 14 Chr. 15 Chr. 16 Chr. 17 Chr. 18 Chr. 19 Chr. 20 Chr. 11 Genetic Diversity • The graph and table summarize the results from the genome scan for selection. The coloured arrows in the graph indicate specific SSR makers which were significant for either or both of the test statistics. • In a reverse genetics approach, 19/22 loci mapped in regions of previously identified QTL on soybase, with the QTL spanning a wide range of traits, especially adaptation-related traits (e.g. maturity/disease resistance). Yield/Protein/MG 00-0 • Cluster analysis grouped the varieties into six clades (Figure 2), which in general, showed high congruence with the known pedigree record. The dendrogram revealed three distinct ancestral clades that are separate from each other as well as the current varieties. • Ancestral group 3 was the most divergent clade, as cultivars in this group had the greatest number of rare alleles which are not transmitted to the future generations. • There was clear allelic stratification among the various cultivars derived from OAC Bayfield, which is related to the shared phenotypic characteristics of the cultivars that group together. The major phenotypic characteristics of the cultivars in the various clades are maturity (range of maturity-from 00-II) and either high total oil content (>20%) or high total protein content (>40%). Yield/Oil/MG 00-1 Conclusion and Future Research • By understanding the nature of the molecular changes to the genome over multiple generations of selection through applied breeding, breeders can gain further knowledge about the specific molecular landscape of their germplasm with respect to a given environment. This can be used as a strategy for incorporating novel beneficial genetic diversity by screening germplasm introductions as well as targeting linkage blocks for recombination or identifying those linkage blocks which are being selectively maintained. As well, QTL which show evidence of selection can be examined in more detail for specific genes located in these regions, especially given the array of high density genomic technologies which are currently available. • The next phase of research will focus on extending this methodology across the pedigrees of the soybean breeding program at the University of Guelph for a comprehensive analysis of the molecular changes to the elite germplasm from over multiple generations of applied breeding. Ancestral Group 2 References Ancestral Group 3 Food Grade/MG II [1] Shoemaker, R.C., R.D. Guffy, L.L. Lorenzen, and J.E. Specht. 1992. Molecular genetic mapping of soybean: Map utilization. Crop Sci. 32:1091-1098. [2] Schlotterer C. A microsatellite-based multilocus screen for the identification of local selective sweeps.Genetics 2002; 160(2):753-763. [3] Casa, A.M., Mitchell, S.E., Hamblin, M.T., Sun, H., Bowers, J.E., Paterson, A.H., Aquadro, C.F. and Kresovich, S. 2005. Diversity and selection in sorghum: simultaneous analysis using simple sequence repeats. Theor Appl Genet; 111:23-30. Ancestral Group 1 Figure 2. Dendrogram of genetic relatedness among member s of OAC Bayfield’s pedigree. Contact: cgrainge@uoguelph.ca