Download
1 / 18
180 likes | 273 Views
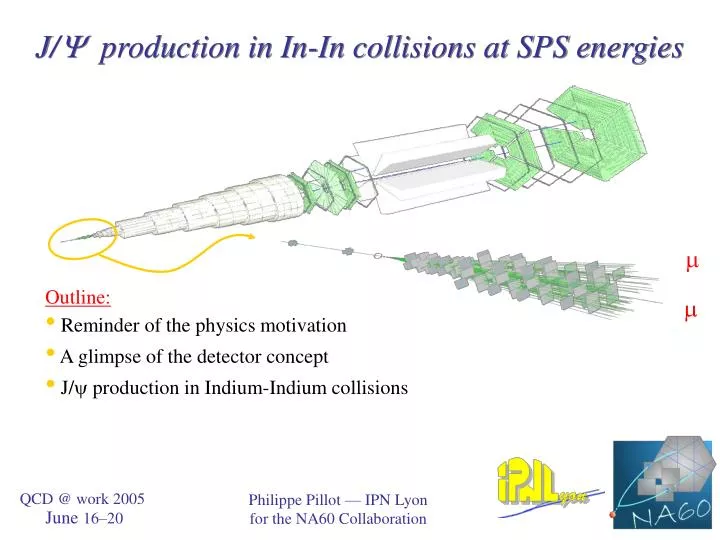
. . J/ production in In-In collisions at SPS energies. Outline: Reminder of the physics motivation A glimpse of the detector concept J/ production in Indium-Indium collisions. QCD @ work 2005 June 16 – 20. Philippe Pillot — IPN Lyon for the NA60 Collaboration.

E N D
J/ production in In-In collisions at SPS energies Outline: • Reminder of the physics motivation • A glimpse of the detector concept • J/ production in Indium-Indium collisions QCD @ work 2005June16–20 Philippe Pillot — IPN Lyonfor the NA60 Collaboration
Physics motivations • QCD predicts that, above a critical temperature or energy density, strongly interacting matter undergoes a phase transition to a new state (QGP) where the quarks and gluons are no longer confined in hadrons, and chiral symmetry is restored. • Since 1986, many experiments have studied high-energy nuclear collisions at the CERN SPS to search for this QCD phase transition. Some of the theory-driven “signatures” required measuring lepton pairs and motivated NA38, CERES, HELIOS-3 and NA50: • changes in the spectral function (mass shifts, broadening, disappearance) when chiral symmetry restoration is approached • the production of thermal dimuons directly emitted from the new phase, if in thermal equilibrium • the suppression of charmonium states (J/, ’, c) dissolved when critical thresholds are exceededSome of the measurements done by these experiments are consistent with the expectations derived from the theoretical predictions in case a QGP phase is formed. This talk will be focused on the suppression of the J/
Projectile “normal nuclear absorption”: Survival probability of the J/ exp(-Labs) J/ abs = 4.18 ± 0.35 mb L • No anomalous suppression is seen in light-ion collisions (O-Cu, O-U and S-U) Target • Anomalous suppression is seen in Pb-Pb New measurements are needed NA60 Experimental observations / Questions that remain open • From p-A collisions at 200, 400, 450 GeV (NA3, NA38, NA50 and NA51): • What is the physics mechanism behind the J/ suppression seen in Pb-Pb collisions? • What is the impact of the c feed-down on the observed J/ suppression pattern? • Is the normal nuclear absorption of the c identical to the one of the J/? • Can we compare proton-nucleus data at 450 GeV with Pb-Pb data at 158 GeV?
The correlation between the different variables, as a function of the centrality of the collision, depends on the colliding system L (fm) Npart What is the physics behind the abnormal suppression ? Study of the J/ abnormal suppression as a function of different variables, with different colliding systems, in order to find the good observable: L, Npart, . For instance, results obtained in the three colliding systems will either overlap when plotted as a function of L or when plotted as a function of Npart NA60 collected data in indium-indium collisions. To be compared with the S-U and Pb-Pb results of NA38/NA50
~ 1m Muon Spectrometer Iron wall Hadron absorber MWPC’s Toroidal Magnet Target area beam Trigger Hodoscopes ZDC Projectile Central collisions Dipole field2.5 T Two data sets collected, with 4000 A and 6500 A in the toroidal magnet target TARGET BOX MUON FILTER BEAMTRACKER VERTEX TELESCOPE IC Peripheral collisions not on scale EZDC Nspectators 158 GeV 0 10 20 TeV NA60’s detector in the 2003 indium run 5-week long run in Oct.–Nov. 2003: ~ 4 × 10¹² ions delivered in total ~ 230 million dimuon triggers on tape L and Npart calculated using the Glauber model
Vertex Telescope Beam Tracker 16 silicon pixel planes 50425 µm2 pixel size ~ 800 000 pixels Silicon strips operated at 130 K(improves radiation hardness) Measurement accuracy of the interaction vertex: • < 20 µm perpendicularly to the beam axis • < 200 µm along the beam axis The vertex telescope Dipole The interaction must take place in one of the seven targets
~ 1m Muon Spectrometer Iron wall MWPC’s Hadron absorber Toroidal Magnet Target area beam Trigger Hodoscopes µ J/ Spectrometer only Spectrometer + telescope µ M (J/) : 10570MeV ’ Matching in coordinate and momentum space • origin of muons can be accurately determined • dimuon mass resolution is improved Matching in coordinate and momentum space Matching in coordinate and momentum space • origin of muons can be accurately determined Matching between the muons and the vertex tracks Matching in coordinate and momentum space • origin of muons can be accurately determined • dimuon mass resolution is improved • but matching efficiency is only 70% (at the )
Combinatorial background from and K decays determined from the measured like-sign pairs Background 6500 A no matching J/ • Signal mass shapes from Monte Carlo: • PYTHIA with GRV94_LO parton densities • GEANT 3.21 for detector simulation • reconstructed as the measured data Charm ’ DY a) M > 4.2 GeV: normalize the DY b) 2.2 < M < 2.5 GeV: normalize the charm (with DY fixed) c) 2.9 < M < 4.2 GeV: get the J/ and ’ yields (with DY & charm fixed) Bµµ(J/) / (DY2.9−4.5) : 21.3 ± 1.3 (6500 unmatched) 19.0 ± 1.2 (4000 unmatched) L = 6.6 fm and Npart = 123 nucleons~ 70 000 J/ events~ 520 events above M = 4.2 GeV Without centrality selection: J/ production in indium-indium collisions preliminary A multi-step fit is performed: Acceptances: J/ : 12.4 % (6500 A); 13.8 % (4000 A) DY : 13.2 % (6500 A); 14.1 % (4000 A) Phase space window: -0.5 < cos CS < 0.5 and 0.0 < ycms < 1.0 Stricter cuts are needed for the analysis versus centrality: ~ 60% of the events are kept 3 centrality bins
Comparison with previous measurements preliminary • The J/ is “anomalously” suppressed in indium-indium collision • In-In, S-U and Pb-Pb points do not overlap as a function of L: the physics behind the “anomalous” J/ suppression does not depend on L • Npart seems to be a much better scaling variable • Studies as a function of energy density and other variables are under way • Number of centrality bins will increase when the “minimum bias analysis” will be available
pT2 = pT2pp + agN L pT2pp is the value that a cc pair has in absence of any scattering L: length of nuclear matter traversed Study of the transverse momentum of the J/ NA3, NA38 and NA50 studied the transverse momentum distributions of the J/ from p-A up to Pb-Pb collisions. NA50 – Quark Matter 2002 Data rescaled to 158 GeV/c The observed increase of the pT2 values has been interpreted in terms of initial-state parton multiple scattering: the number of g-N scatterings grows linearly with L, resulting in a higher pT2 for the J/
6500 A no matching 1/pT dN/dpT pT (GeV/c) pT distribution analysis For this study, we select dimuons in the mass range [2.9,3.3] GeV The pT distribution is corrected for the acceptance of the experimental apparatus, calculated from Monte-Carlo simulations The pT2 value is extracted Analysis versus centrality: ~ 40 000 J/ events 7 centrality bins have been defined
pT2J/ (GeV/c)2 L (fm) Results on the pT2 of the J/ • Compatible results between NA50 and NA60 • The Indium points are well reproduced by the initial-state parton multiple scattering model preliminary pT2 = pT2pp + agN L
Summary and outlook • The J/ / DY cross section ratio in Indium-Indium collisions, in 3 centrality bins, shows that the In and Pb patterns overlap reasonably well in Npart but not in L • Work is on-going to increase the number of centrality bins, deriving the DY reference from the measured minimum bias events, and to study the overlap of the In and Pb patterns using other physics variables (energy density, etc) • The <pT2> of the J/ in In-In follows the pattern defined by the Pb-Pb points as a function of L, reinforcing the interpretation ofinitial-state parton multiple scattering • To understand the production and suppression of charmonium states in heavy-ion collisions, a solid reference baseline from proton-nucleusdata is needed. In 2004, NA60 took data with proton beams incident on 7 different nuclear targets: • at 400 GeV: to study the impact of c production on the J/ suppression • at 158 GeV: to extract the normal nuclear absorption of the J/ at the energy of the heavy ion data
Furthermore, the analysis of the dimuon mass spectra after muon track matching leads to essentially the same numerical values. 6500 A after muon track matching preliminary Matching Stability checks • We changed several steps in the analysis procedure to check the stability of the results: • data selection • background estimation • parameterization of the signal shapes • fitting procedure Systematical uncertainties are still under study; should be similar to the statistical errors when no centrality selection is done and smaller in the analysis versus centrality
Since the different kinematical variables are related, the acceptance in one variable can have a strong dependence on other variables. To take into account these correlations, two methods have been used: pT distribution analysis 6500 A no matching For this study, we select dimuons in the mass range [2.9,3.3] GeV The pT distribution is corrected for the acceptance of the experimental apparatus, calculated from Monte-Carlo simulations • Monte Carlo events have been generated using cosCS andydistributions which reproduce the acceptance-corrected experimental data • Monte Carlo events have been generated with flatpT, cosCSandydistributions 3-D acceptance matrices The two methods lead essentially to the same numerical values ~ 40 000 J/ events 7 centrality bins have been defined