Download
1 / 1
10 likes | 100 Views
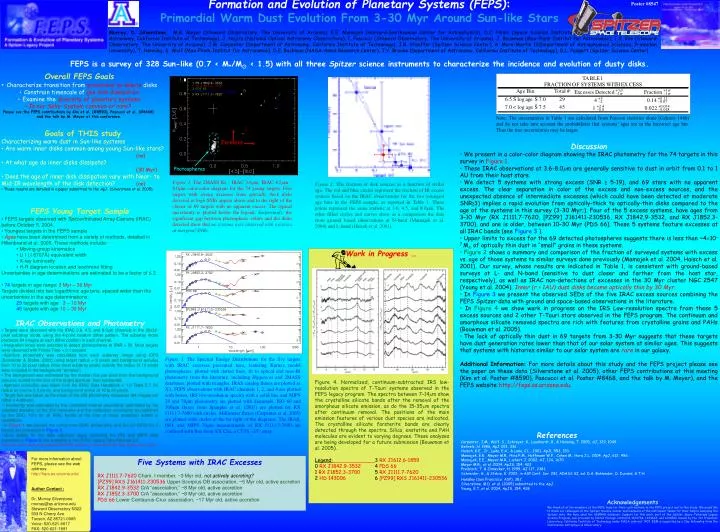
Formation and Evolution of Planetary Systems (FEPS) : Primordial Warm Dust Evolution From 3-30 Myr Around Sun-like Stars. Poster #8547.

E N D
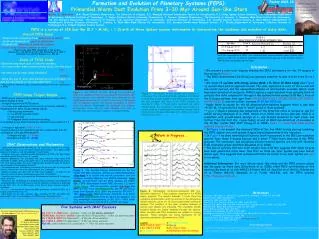
Formation and Evolution of Planetary Systems (FEPS): Primordial Warm Dust Evolution From 3-30 Myr Around Sun-like Stars Poster #8547 Note: The uncertainties in Table 1 are calculated from Poisson statistics alone (Gehrels 1986) and do not take into account the probabilities that systems’ ages are in the incorrect age bin. Thus the true uncertainties may be larger. Five Systems with IRAC Excesses RX J1111.7-7620 Cham. I member, ~3 Myr old, not actively accreting? [PZ99] RXS J161411-230536Upper-Scorpius OB association, ~5 Myr old, active accretion RX J1842.9-3532 CrA “association,” ~8 Myr old, active accretion RX J1852.3-3700 CrA “association,” ~8 Myr old, active accretion PDS 66 Lower Centaurus-Crux association, ~17 Myr old, active accretion Murray. D. Silverstone, M.R. Meyer (Steward Observatory, The University of Arizona), E.E. Mamajek (Harvard-Smithsonian Center for Astrophysics), D.C. Hines (Space Science Institute), L.A. Hillenbrand (Department of Astronomy, California Institute of Technology), J. Najita (National Optical Astronomy Observatory), I. Pascucci (Steward Observatory, The University of Arizona), J. Bouwman (Max-Plank-Institut für Astronomie), J.S. Kim (Steward Observatory, The University of Arizona), J.M. Carpenter (Department of Astronomy, California Institute of Technology), J.R. Stauffer (Spitzer Science Center), A. Moro-Martin 12(Department of Astrophysical Sciences, Princeton University), T. Henning, S. Wolf (Max-Plank-Institut für Astronomie), D.E. Backman (NASA-Ames Research Center), T.Y. Brooke (Department of Astronomy, California Institute of Technology), D.L. Padgett (Spitzer Science Center) FEPS is a survey of 328 Sun-like (0.7 < M*/M < 1.5) with all three Spitzer science instruments to characterize the incidence and evolution of dusty disks. • Overall FEPS Goals • Characterize transition fromprimordial to debrisdisks • Constrain timescale ofgas disk dissipation • Examine thediversity of planetary systems • Is our Solar System common or rare? • Please see the FEPS contributions by Kim et al. (#8590), Pascucci et al. (#8468) • and the talk by M. Meyer at this conference. • Goals of THIS study • Characterizing warm dust in Sun-like systems • Are warm inner disks common among young Sun-like stars? (no) • At what age do inner disks dissipate? (30 Myr) • Does the age of inner disk dissipation vary with Near- to Mid-IR wavelength of the disk detection? (no) • These results are detailed in a paper submitted to the ApJ (Silverstone et al. 2005). Excesses • Discussion • We present in a color-color diagram showing the IRAC photometry for the 74 targets in this survey in Figure 1. • These IRAC observations at 3.6-8.0mm are generally sensitive to dust in orbit from 0.1 to 1 AU from their host stars. • We detect 5 systems with strong excess (SNR ≥ 5-19), and 69 stars with no apparent excess. The clear separation in color of the excess and non-excess sources, and the unexpected absence of intermediate excesses (which could have been detected at moderate SNR≥3) implies a rapid evolution from optically-thick to optically-thin disks compared to the age of the systems in this survey (3-30 Myr;). Four of the 5 excess systems, have ages from 3–10 Myr (RX J1111.7-7620, [PZ99] J161411-230536, RX J1842.9-3532, and RX J1852.3-3700), and one is older, between 10–30 Myr (PDS 66). These 5 systems feature excesses at all IRAC bands (see Figure 3 ). • Upper limits to excess for the 69 detected photospheres suggests there is less than ~410–7 M of optically thin dust in “small” grains in these systems. • Figure 2 shows a summary and comparison of the fraction of surveyed systems with excess vs. age of those systems to similar surveys done previously (Mamajek et al. 2004, Haisch et al. 2001). Our survey, whose results are indicated in Table 1, is consistent with ground-based surveys at L- and N-band (sensitive to dust closer and farther from the host star, respectively), as well as IRAC non-detections of excesses in the 30 Myr cluster NGC 2547 (Young et al. 2004). Inner (r < 1AU) dust disks become optically thin by 30 Myr. • In Figure 3 we present the observed SEDs of the five IRAC excess sources combining the FEPS Spitzer data with ground and space-based observations in the literature. • In Figure 4 we show work in progress on the IRS Low-resolution spectra from these 5 excess sources and 2 other T-Tauri stars observed in the FEPS program. The continuum and amorphous silicate removed spectra are rich with features from crystalline grains and PAHs (Bouwman et al. 2005). • The lack of optically thin dust in 69 targets from 3-30 Myr suggests that these targets have dust generation rates lower than that of our solar system at similar ages. This suggests that systems with histories similar to our solar system are rare in our galaxy. • Additional Information: For more details about this study and the FEPS project please see the paper on these data (Silverstone et al. 2005), other FEPS contributions at this meeting (Kim et al. Poster #8590), Pascucci et al. Poster #8468, and the talk by M. Meyer), and the FEPS website http://feps.as.arizona.edu. Photospheres Figure 1. The 2MASS Ks - IRAC 3.6mm, IRAC 4.5mm - 8.0mm color-color diagram for the 74 young targets. Five targets with strong excesses from optically thick disks detected at high SNRs appear above and to the right of the cluster of 69 targets with no apparent excess. The typical uncertainty is plotted below the legend. Surprisingly, the significant gap between photospheric colors and the disks detected show that no systems were observed with excesses at marginal SNRs. Figure 2: The fraction of disk sources as a function of stellar age. The red and blue circles represent the fraction of IR excess sources based on the IRAC observations for the two youngest age bins in the FEPS sample, as reported in Table 1. These points represent the same statistic at 3.6, 4.5, and 8.0mm. The other filled circles and curves show as a comparison the data from ground based observations at N-band (Mamajek et al. 2004) and L-band (Haisch et al. 2001). • FEPS Young Target Sample • FEPS targets observed with Spitzer/Infrared Array Camera (IRAC) before October 5, 2004. • Youngest targets in the FEPS sample • Ages have been determined from a variety of methods, detailed in Hillenbrand et al. 2005. These methods include: • • Moving-group kinematics • • Li I (l 6707Å) equivalent width • • X-ray luminosity • • H-R diagram location and isochrone fitting • Uncertainties in age determinations are estimated to be a factor of ≤ 2. • 74 targets in age range: 3 Myr – 30 Myr • Targets divided into two logarithmic age bins, spaced wider than the uncertainties in the age determinations: • 29 targets with age 3 – 10 Myr • 45 targets with age 10 – 30 Myr • IRAC Observations and Photometry • Targets were observed with the IRAC 3.6, 4.5, and 8.0mm channels in the 32x32-pixel subarray mode, using the 4-point random dither pattern. The subarray mode produces 64 images at each dither position in each channel. • Integration times were selected to detect photospheres at SNR > 50. Most targets were observed with Frame Time = 0.1 second • Aperture photometry was calculated from each subarray image using IDP3 (Schneider & Stobie, 2002) using target radius = 3 pixels and background annulus from 10 to 32 pixel radius (thus most subarray pixels outside the radius of 10 pixels were included in the background “annulus”). • The background was estimated by the median flux per pixel from the background annulus, scaled to the size of the target aperture, then subtracted. • Aperture correction was taken from the IRAC Data Handbook v. 1.0 Table 5.7, for radius on source 3.0 pixels, and background annuli of 10 to 20 pixels. • Target flux was taken as the mean of the 256 photometry measures (64 images per dither x 4 dithers). • Uncertainty was estimated by the combined internal uncertainty (estimated by the standard deviation of the 256 measures and the calibration uncertainty as published by the SSC, 10% for all IRAC bands at the time of these analyses) added in quadrature. • In Figure 1 we present the colors from IRAC photometry, and the full SEDs for 5 targets are presented inFigure 3. • More details for the data reduction steps (including the IRS and MIPS data presented inFigure 3) are available in the FEPS Legacy Data Release 2.0* • *http://data.spitzer.caltech.edu/popular/feps/20050608_enhanced_v1/Documents/FEPS_Data_Explan_Supp_v2.pdf Work in Progress … Figure 3. The Spectral Energy Distributions for the five targets with IRAC excesses presented here, featuring Kurucz model photospheres, plotted with dotted lines, fit to optical and near-IR photometry from the literature, including Hipparcos and 2MASS databases, plotted with triangles. IRAS catalog fluxes are plotted as X's. FEPS observations with IRAC channels 1, 2, and 4 are plotted with boxes, IRS low-resolution spectra with a solid line and MIPS 24 and 70mm photometry are plotted with diamonds. ISO 60 and 100mm fluxes from Spangler et al. (2001) are plotted for RX J1111.7-7600 with circles. Millimeter fluxes (Carpenter et al. 2005) are plotted with circles at the far right of the diagrams. The IRAS, ISO, and MIPS 70mm measurements of RX J1111.7-7600 are confused with flux from XX Cha, a CTTS ~25" away. Figure 4. Normalized, continuum-subtracted IRS low-resolution spectra of T-Tauri systems observed in the FEPS legacy program. The spectra between 7–14mm show the crystalline silicate bands after the removal of the amorphous silicate emission, as do the 15–35mm spectra after continuum removal. The positions of the main emission features of various dust species are indicated. The crystalline silicate forsterite bands are clearly detected through the spectra. Silica, enstatite and PAH molecules are evident to varying degrees. These analyses are being developed for a future submission (Bouwman et al. 2005). Legend:3 RX J1612.6-1859 0 RX J1842.9-3532 4 PDS 66 1 RX J1852.3-3700 5 RX J1111.7-7620 2 HD 143006 6 [PZ99] RXS J161411-230536 References Carpenter, J.M., Wolf, S., Schreyer, K., Launhardt, R., & Henning, T. 2005, AJ, 129, 1049. Gehrels, N. 1986, ApJ 303, 336. Haisch, K.E., Jr., Lada, E.A., & Lada, C.L., 2001, ApJL 553, 153. Mamajek, E.E., Meyer M.R., Hinz P.M., Hoffmann W.F., Cohen M., Hora J.L. 2004, ApJ, 612, 496 . Mamajek, E.E., Meyer M.R., Liebert J. 2002, AJ, 124, 1670 Meyer M.R., et al. 2004, ApJS, 154, 422 Preibisch, T. & Zinnecker, H. 1999, AJ 117, 2381. Schneider, G., & Stobie, E. 2002, in ASP Conf. Ser. 281, ADASS XI, ed. D.A. Bohlender, D. Durand, & T.H. Handley (San Francisco: ASP), 382 Silverstone, M.D. et al. (2005) submitted to the ApJ. Young, E.T.,et al. 2004, ApJS, 154, 428 For more information about FEPS, please see the web address: http://feps.as.arizona.edu/ Author Contact : Dr. Murray Silverstone murray@as.arizona.edu Steward Observatory N322 933 N Cherry Ave Tucson, AZ 85721-0065 Voice: 520-621-6617 FAX: 520-621-1891 Acknowledgements We thank all of the members of the FEPS team for their contributions to the FEPS project and to this study. We would like to thank our colleagues at the Spitzer Science Center and members of the instrument teams for their help in analyzing the Spitzer data. We have used the SIMBAD database. Support for this work, part of the SpitzerSpace Telescope Legacy Science Program, was provided by NASA through contracts 1224768, 1224634, and 1224566 issued by the Jet Propulsion Laboratory, California Institute of Technology under NASA contract 1407. EEM is supported by a Clay fellowship from the Smithsonian Astrophysical Observatory