Download
1 / 8
80 likes | 180 Views
Simple Example. There are 20 Form 6 students of different heights;Line up the students according to their heightsLabel their respective heights as A, B, C, etc.;Divide them into 10 groups called deciles (each contains one-tenth of the total number)Note: 100 parts are percentiles ? 1 decile is

E N D
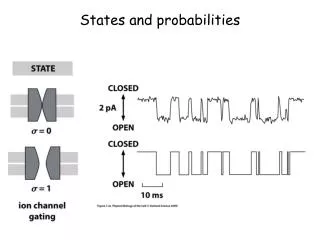
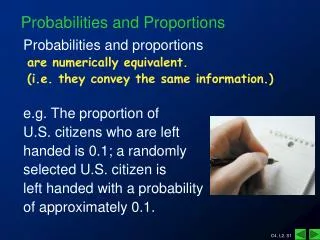
1. Probabilities and their Interpretations
2. Simple Example There are 20 Form 6 students of different heights;
Line up the students according to their heights
Label their respective heights as A, B, C, etc.;
Divide them into 10 groups called deciles (each contains one-tenth of the total number)
Note: 100 parts are percentiles ? 1 decile is 10 percentiles
3. Now suppose the students were sitting randomly in a classroom;
If you selected any student, there is a 10% chance or probability of the student being in any particular decile;
You have 30% chance (i.e. 6 out of 20) of selecting someone with either height F or lower (deciles 1,2,3) or above height N (deciles 8,9, 10) ? shorter than normal and taller than normal;
There is 40% chance of selecting one of the remaining students who have heights greater than F and less than equal to N ? near normal.
4. Rainfall Probabilities A set of rainfall records taken over a number of period (at least 30 years);
Rank all the totals at a location for virtually any similar period of whole months;
Divide ranked amounts into ten equal deciles;
Rainfall below the 30th decile (1,2,3) is called below normal or below average and above 70th decile (8,9,10) is called above normal or above average ? climatological probabilities
5. Terciles�Simple Example Roll a fair six-sided die, you chances of rolling a 3, are 1 in 6.
The chances of rolling (unbiased):
1 or 2 is two in six i.e. 33%
3 or 4 is two in six i.e. 33%
5 or 6 is two in six i.e. 33%
There are three equal groups therefore they are called terciles.
Roll the die many times ? 1/3 of the numbers will be in each tercile
6. 2 is the 33rd percentile because 33% of the numbers on a die are less than or equal to this;
4 is the 67th percentile because 67% of the numbers on a die are less than or equal to this;
In a bias situation, die is slightly heavier on some six faces ? higher chances of occurring
7. Rainfall Terciles Now for the same set of rainfall values, instead of dividing into ten equal parts (deciles), divide them into three equal parts (terciles);
There is equal chance of rainfall falling into each tercile (unbiased)
Tercile 1 ? less than or equal to 33rd percentile ? below average ? dry conditions
Tercile 2 ? between 33rd and 67th percentile ? average ? normal conditions
Tercile 3 ? greater than or equal to 67th percentile ? above average ? wet conditions
8. In a bias situation, rainfall is dependent on El Ni�o, La Ni�a or normal condition
Examples:
During an El Ni�o, there is a higher chance of below average rainfall (tercile 1) ? 1997/1998;
During a La Ni�a, there is a higher chance of above average rainfall (tercile 3) ? 1999/present