Download
1 / 1
10 likes | 164 Views
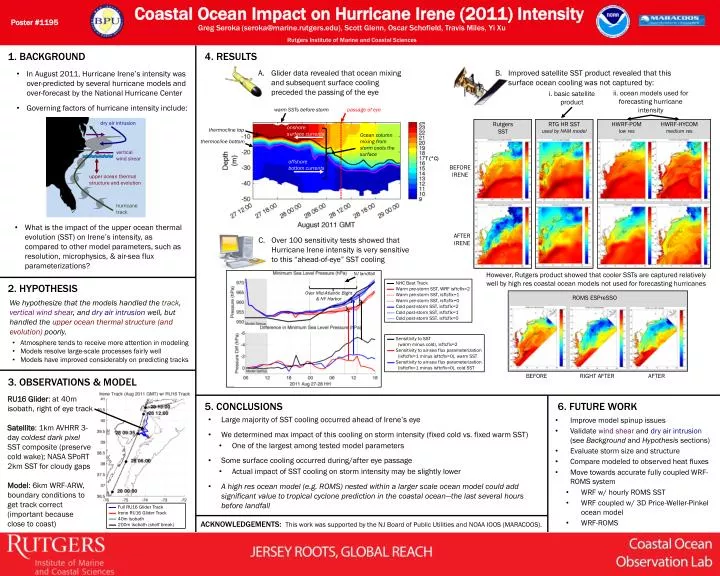
Poster #1195. Greg Seroka (seroka@ marine.rutgers.edu ), Scott Glenn, Oscar Schofield, Travis Miles, Yi Xu Rutgers Institute of Marine and Coastal Sciences. 1. BACKGROUND . 4. RESULTS. Glider data revealed that ocean mixing and subsequent surface cooling preceded the passing of the eye.

E N D
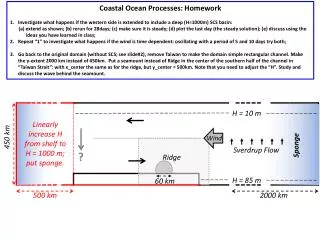
Poster #1195 Greg Seroka(seroka@marine.rutgers.edu), Scott Glenn, Oscar Schofield, Travis Miles, Yi Xu Rutgers Institute of Marine and Coastal Sciences 1. BACKGROUND 4. RESULTS Glider data revealed that ocean mixing and subsequent surface cooling preceded the passing of the eye Improved satellite SST product revealed that this surface ocean cooling was not captured by: • In August 2011, Hurricane Irene’s intensity was over-predicted by several hurricane models and over-forecast by the National Hurricane Center • Governing factors of hurricane intensity include: ii. ocean models used for forecasting hurricane intensity i. basic satellite product warm SSTs before storm passage of eye onshore surface currents dry air intrusion Rutgers SST HWRF-POM low res HWRF-HYCOM medium res RTG HR SST used by NAM model thermocline top Ocean column mixing from storm cools the surface thermocline bottom vertical wind shear T (°C) offshorebottom currents BEFORE IRENE upper ocean thermal structure and evolution Coastal Ocean Impact on Hurricane Irene (2011) Intensity hurricane track • What is the impact of the upper ocean thermal evolution (SST) on Irene’s intensity, as compared to other model parameters, such as resolution, microphysics, & air-sea flux parameterizations? AFTER IRENE Over 100 sensitivity tests showed that Hurricane Irene intensity is very sensitive to this “ahead-of-eye” SST cooling However, Rutgers product showed that cooler SSTs are captured relatively well by high res coastal ocean models not used for forecasting hurricanes NJ landfall NHC Best Track Warm pre-storm SST, WRF isftcflx=2 Warm pre-storm SST, isftcflx=1 Warm pre-storm SST, isftcflx=0 Cold post-storm SST, isftcflx=2 Cold post-storm SST, isftcflx=1 Cold post-storm SST, isftcflx=0 2. HYPOTHESIS Over Mid-Atlantic Bight& NY Harbor ROMS ESPreSSO We hypothesize that the models handled the track, vertical wind shear, and dry air intrusion well, but handled the upper ocean thermal structure (and evolution) poorly. Sensitivity to SST(warm minus cold), isftcflx=2 Sensitivity to air-sea flux parameterization (isftcflx=1 minus isftcflx=0), warm SST Sensitivity to air-sea flux parameterization (isftcflx=1 minus isftcflx=0), cold SST • Atmosphere tends to receive more attention in modeling • Models resolve large-scale processes fairly well • Models have improved considerably on predicting tracks BEFORE RIGHT AFTER AFTER 3. OBSERVATIONS & MODEL RU16 Glider: at 40m isobath, right of eye track Satellite: 1km AVHRR 3-day coldest dark pixel SSTcomposite (preserve cold wake); NASA SPoRT 2km SST for cloudy gaps Model: 6km WRF-ARW, boundary conditions to get track correct (important because close to coast) 5. CONCLUSIONS 6. FUTURE WORK • Large majority of SST cooling occurred ahead of Irene’s eye • We determined max impact of this cooling on storm intensity (fixed cold vs. fixed warm SST) • One of the largest among tested model parameters • Some surface cooling occurred during/after eye passage • Actual impact of SST cooling on storm intensity may be slightly lower • A high res ocean model (e.g. ROMS) nested within a larger scale ocean model could add significant value to tropical cyclone prediction in the coastal ocean—the last several hours before landfall • Improve model spinup issues • Validate wind shear and dry air intrusion (see Background and Hypothesis sections) • Evaluate storm size and structure • Compare modeled to observed heat fluxes • Move towards accurate fully coupled WRF-ROMS system • WRF w/ hourly ROMS SST • WRF coupled w/ 3D Price-Weller-Pinkel ocean model • WRF-ROMS Acknowledgements: Full RU16 Glider Track Irene RU16 Glider Track 40m isobath 200m isobath (shelf break) ACKNOWLEDGEMENTS: This work was supported by the NJ Board of Public Utilities and NOAA IOOS (MARACOOS).