Download
1 / 26
280 likes | 448 Views
Optical Topography: An overview. Nima Kasraie Spring 2007. What When Where. Oxymetric Near Infrared Imaging Images higher order brain functions Developed by Hitachi Advanced Research Laboratory Already in clinical use in Japan. Red Light Transmission . Features. Small Easy to use

E N D
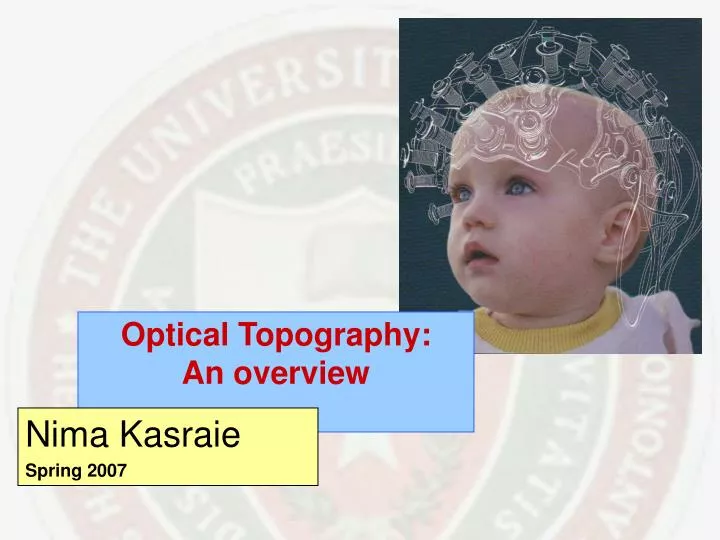
Optical Topography: An overview Nima Kasraie Spring 2007
What When Where • Oxymetric Near Infrared Imaging • Images higher order brain functions • Developed by Hitachi Advanced Research Laboratory • Already in clinical use in Japan.
Features • Small • Easy to use • Patient mobility • Extended recordings • Not noisy • Aclaustrophobic • “Real time” imaging
Principle of OT system • 1.5mW NIR laser diode illuminates head from optical fibers attached to headset. • dmax≈ 3cm • Reflection (0.1%) • Detection
780nm • 830nm
Simultaneous position encoding by frequency modulation produces a better SNR than time-sharing and time-resolved methods. • Optimal wavelength pair: 830/692 nm. • Applicable to other molecular species
The presence of low frequency modulation of both vascular (Hb, HbO) and metabolic responses to visual stimuli with unknown origin have been observed. • The cause of these low frequency oscillations are not exactly known • but may be attributed to extra-cerebral activities such as respiration. • One method of removing the low frequency artifact is to convolve the response signal with a model of stimulus signal.
In concept fMRI measures differences between the Fe content in blood based on the metal’s response to the magnetic field. OT relies on different light absorption characteristics of the two forms.
In operation Lower spatial resolution than fMRI 2mm vs. 20mm Higher temporal resolution than fMRI 1 Sec vs. 1 mSec
fMRI and OT can be complementary • Can also be combined with structural imaging
Current applications • Developmental plasticity • Neonatology (only functional imaging method) • Neurosurgery • Identifying the focus of epileptic seizures i.e. check for dominant hemisphere (e.g. Broca’s area) before removal of eliptogenic tissue
Concluding remark OT does not measure exact blood volume concentrations; it measures concentration changes of molecular species, including oxyhemoglobin and deoxyhemoglobin.
References and further reading • Spinney, Laura. "Optical topography and the color of blood: OT gives neuroscientists a new and faster view of the brain, and an alternative to fMRI." The Scientist 19.2 (Jan 31, 2005): 25(3). • Hideaki Koizumi, “Optical topography: practical problems and new applications”. Applied Optics, Vol. 42, No. 16, June 2003 • Il-Young Son, “Near Infrared Imaging and Spectroscopy for Brain Activity Monitoring”. • http://www.medphys.ucl.ac.uk/research/borl/sheddinglight/brain.htm • http://www.hitachi-medical.co.jp/info/opt-e/index.html