Download
1 / 25
260 likes | 652 Views
Welcome Presentation / Discussion On Management of Distribution of Power Karnataka. PROFILE OF Karnataka (2006-07). Installed Capacity – 7678 MW Energy Availability – 38057 mU Peak Demand - 5576 MW

E N D
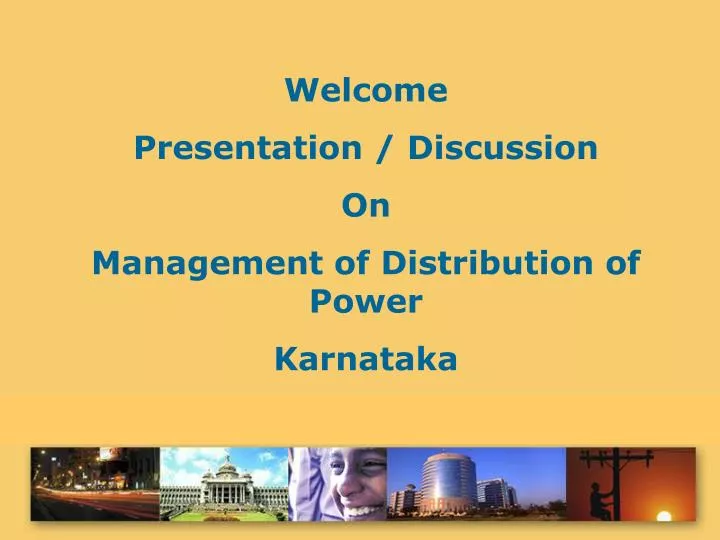
Welcome Presentation / Discussion On Management of Distribution of Power Karnataka
PROFILE OF Karnataka (2006-07) • Installed Capacity – 7678 MW • Energy Availability – 38057 mU • Peak Demand - 5576 MW • Average Delivery cost – Rs 3.55/Unit • Average Rate of Realization- Rs 2.90/Unit • Average Power purchase Cost- Rs 1.82/Unit • No of Sub-Stations – 830 Nos • EHT lines – 32036 ckt kms • Employee Strength • Sanctioned – 11,312 nos. • Working – 5,440 nos. • T & D Losses - 27 % • Transmission Loss - 4.18 % • CAPEX (06-07) - Rs 2700 Crs
Four Pillars of Distribution Reforms Competitive Power Generation Creating robust infrastructure Better Quality / Quantity of Power ROI and Boost efficiencies all around How did we start ? 5 DISCOMS formed Stronger control of resources Audits / Checks to optimse Performance incentives Reforms effect on Distribution
Issues on Hand Huge losses – resource loss for new investments Low Consumer Satisfaction – Problem with quality,quantity,pricing etc Poor Employee Morale –Employees lacked motivation to perform Managing Distribution
Reduce Loss / Introduce Auditing Beef up production / track the power Innovate to boost employee morale Involve people, Gain respect ESCOM Strategy
ESCOM Program - Grama Vidyuth Prathinidhis Meter Reading, Billing Distribution and Revenue Collection. Depositing the Collections with the Utility. Registering Complaints and Forwarding to Utility. Facilitating attending the Grievances of Consumers - Domestic, AEH,Commercial, Small & Medium Industries Regular Feed Back about Field Realities Result ? 3425 GVPs in 5605 GPs /Revenue Collection up 30% Involving PeopleImproving rural revenues
Energy Audit of DTC’s( as on 31.03.2006) 88.99% 77.45%
Energy Audit of DTC’s( as on 31.03.2006) 58.68% 31.56% 5.85% 1.88% 2.63%
Transmission Losses reduced from 6.2% to 4.18% Power Generation up Distribution losses down by 6 % - About 2100 Million Units ploughed back into the system for consumers Metering up by 88.5%- ( Barring exceptions such as IP Sets, BJ ,Street Light ) Pre Paid metering / Spot Billing Payment Conveniences (ATPs) and Grievance Redressal (Sounjanya Counters) Industries / Businesses in Bangalore now get Un restricted Power Some results
Distribution automation in BESCOM Japan aid to boost distribution capacities Smart management of AB Tariff -No Grid Failure 24 Hours power supply for rural areas 55 Parameter Performance appraisal for DISCOMS to compete Usage of Technology in a big way Consumer friendly initiatives Rated as One of the Best in India ESCOM Goals – Directly affecting Consumers
Increase spending -Creating world class infrastructure Rs.2700 Crores One Sub Station a day New Distribution Transformers in all DISCOMS Reconditioning of Existing Infrastructure Outer Ring Strategy – Connecting all Industrial areas Spending Rs 4000 Crores in Distribution for providing Quality, Reliable and Un interrupted Power Supply to Consumers. Building Strengths- Way Forward
Bangalore is First in Karnataka / India having ZERO Distribution Transformer failure since 3 Years 9.5% Energy Loss registered in Bangalore, the lowest in the cities in India The net increase of Revenue on account of Efficiency measures is about Rs. 566 Crores during One Year Distribution Success - BESCOM
ESCOM Tasks for the year • Aim to be Best in India • Focus on ESCOMS with 55 Parameters bench marked • Each Division to be a Strategic Business Unit • Matrix of Performance is devised • Incentives/ Disincentives for ESCOMS • Focus on the Transmission & Distribution- Tripling the Capital investment • Metering all Installations /Re conductoring of Trunk feeders • Big injection of MIS-IT initiatives • Consumer Billing on the Net / e-tendering • Centralised Billing information • 24 Hours customer care centre
Major Initiatives that will substantially improve the power distribution metrics • Quality Power for all by 2008 – Fillip to Industries / Homes • Intra- State Availability Based tariff (ABT) – Competing for the benefit of Consumers • Integrates SCADA – Power Management that will test skills of Corporates / Industries
KPTCL & ESCOMS are making focused efforts at Reaching electricity to uncovered 463 villages &15756 hamlets through RGGVY. Improving rural distribution network through franchisee models to improve revenues, reduce AT&C losses, trim costs & provide continuous and reliable power supply. Putting in place an effective and workable consumer grievance redressal mechanism for improved supply quality. Distribution & Rural Electrification -Improvement Initiatives In Karnataka
Turnkey contracting through competitive bidding process for participation of private entrepreneurs, private and public institutions in the distribution network improvement programs. Facilitating time bound implementation of these programs to avoid cost & time overruns and to keep pace with central calendar of objectives. Encouraging private participation in non-conventional sources of generation. Adoption of PPP model for achieving goals
1.Input Based Franchisee - External (IBF-E) Distribution feeder is the unit. Value of input energy based on BST, related to baseline revenue loss saving 40 distribution feeders in HESCOM covered. HESCOM proposes to extend IBF-E to 300 more feeders Franchisee models in operation
2. Micro-Feeder franchisee(MFF) / Gram Vidyut Pratinidhi (GVP) Gram Panchayat area covering an avarage of 8 villages is unit. 3425 GVPs operating against 5606 gram panchayats.-effort is to maximize coverage. Proposing to convert GVP to MFF framework involving additional functions – compilation of real time data base on consumers & assets , assisting ESCOMS in universal metering etc..laced with added incentives. Franchisee models in operation (contd)
3. Distribution management through Panchayat Raj Institutions Gram Panchayat area is the unit. Overall transfer time proposed as 5 years. Framework includes capacity building in gram panchayat in a. Consumer meter reading, billing & collection b.Service connection & maintenance functions c. Asset Management Franchisee Models In Operatin (contd)
4. Internal Input Based Franchising Model (IIBF) Employees at sub – division level are encouraged to take up distribution feeder improvement. Incentives paid for management performance improvement as benchmarked Objective is to instill a sense of ownership to employees. Getting good response from MESCOM, CESCO and BESCOM Franchisee Models In Operation (contd)
Making franchisee framework attractive to participants in the franchisee operations. Fixing a turn around time table for sustainable, better managed & more rewarding distribution feeder network. Enabling ratio rework of technical & commercial losses Creation of comprehensive and dependable consumer information system Providing reliability and clarity to consumer and asset data for proper risk evaluation and management Objectives of franchising
We have put in place Propoer contractual, legal & commercial framework for franchisee operation. Attractive incentive schemes to franchisees for various operations related to deliverables. Sound monitoring guidelines for improved performace measurement. Sound evaluation yardsticks for franchisee performance. Mechanism in Place for implementation