Download
1 / 1
10 likes | 149 Views
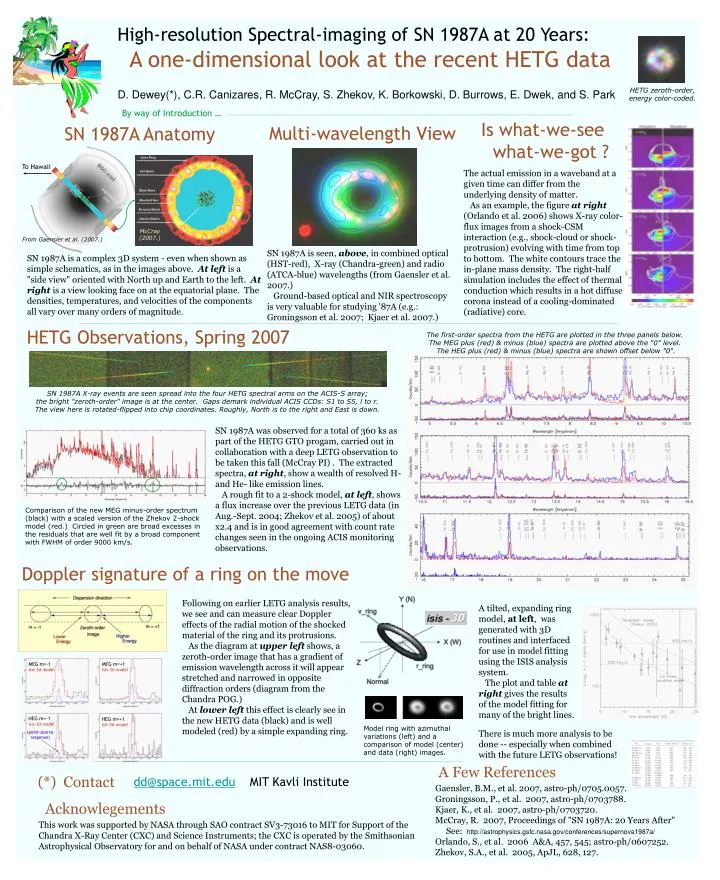
High-resolution Spectral-imaging of SN 1987A at 20 Years: A one-dimensional look at the recent HETG data. HETG zeroth-order, energy color-coded. D. Dewey(*), C.R. Canizares, R. McCray, S. Zhekov, K. Borkowski, D. Burrows, E. Dwek, and S. Park. By way of Introduction …. Is what-we-see

E N D
High-resolution Spectral-imaging of SN 1987A at 20 Years: A one-dimensional look at the recent HETG data HETG zeroth-order,energy color-coded. D. Dewey(*), C.R. Canizares, R. McCray, S. Zhekov, K. Borkowski, D. Burrows, E. Dwek, and S. Park By way of Introduction … Is what-we-see what-we-got ? Multi-wavelength View SN 1987A Anatomy To Hawaii The actual emission in a waveband at a given time can differ from the underlying density of matter. As an example, the figure at right (Orlando et al. 2006) shows X-ray color-flux images from a shock-CSM interaction (e.g., shock-cloud or shock-protrusion) evolving with time from top to bottom. The white contours trace the in-plane mass density. The right-half simulation includes the effect of thermal conduction which results in a hot diffuse corona instead of a cooling-dominated (radiative) core. McCray(2007.) From Gaensler et al. (2007.) SN 1987A is seen, above, in combined optical (HST-red), X-ray (Chandra-green) and radio (ATCA-blue) wavelengths (from Gaensler et al. 2007.) Ground-based optical and NIR spectroscopy is very valuable for studying '87A (e.g.: Groningsson et al. 2007; Kjaer et al. 2007.) SN 1987A is a complex 3D system - even when shown as simple schematics, as in the images above. At left is a "side view" oriented with North up and Earth to the left. At right is a view looking face on at the equatorial plane. The densities, temperatures, and velocities of the components all vary over many orders of magnitude. HETG Observations, Spring 2007 The first-order spectra from the HETG are plotted in the three panels below. The MEG plus (red) & minus (blue) spectra are plotted above the "0" level. The HEG plus (red) & minus (blue) spectra are shown offset below "0". SN 1987A X-ray events are seen spread into the four HETG spectral arms on the ACIS-S array;the bright "zeroth-order" image is at the center. Gaps demark individual ACIS CCDs: S1 to S5, l to r. The view here is rotated-flipped into chip coordinates. Roughly, North is to the right and East is down. SN 1987A was observed for a total of 360 ks as part of the HETG GTO progam, carried out in collaboration with a deep LETG observation to be taken this fall (McCray PI) . The extracted spectra, at right, show a wealth of resolved H- and He- like emission lines. A rough fit to a 2-shock model, at left, shows a flux increase over the previous LETG data (in Aug.-Sept. 2004; Zhekov et al. 2005) of about x2.4 and is in good agreement with count rate changes seen in the ongoing ACIS monitoring observations. Comparison of the new MEG minus-order spectrum (black) with a scaled version of the Zhekov 2-shock model (red.) Circled in green are broad excesses in the residuals that are well fit by a broad component with FWHM of order 9000 km/s. Doppler signature of a ring on the move Following on earlier LETG analysis results, we see and can measure clear Doppler effects of the radial motion of the shocked material of the ring and its protrusions. As the diagram at upper left shows, a zeroth-order image that has a gradient of emission wavelength across it will appear stretched and narrowed in opposite diffraction orders (diagram from the Chandra POG.) At lower left this effect is clearly see in the new HETG data (black) and is well modeled (red) by a simple expanding ring. A tilted, expanding ring model, at left, was generated with 3D routines and interfaced for use in model fitting using the ISIS analysis system. The plot and table at right gives the results of the model fitting for many of the bright lines. MEG m=-1isis-3d model MEG m=+1isis-3d model HEG m=-1isis-3d model HEG m=+1isis-3d model Model ring with azimuthal variations (left) and a comparison of model (center) and data (right) images. There is much more analysis to be done -- especially when combined with the future LETG observations! (point-sourceresponse) A Few References (*) Contact dd@space.mit.edu MIT Kavli Institute Gaensler, B.M., et al. 2007, astro-ph/0705.0057. Groningsson, P., et al. 2007, astro-ph/0703788. Kjaer, K., et al. 2007, astro-ph/0703720. McCray, R. 2007, Proceedings of "SN 1987A: 20 Years After" See: http://astrophysics.gsfc.nasa.gov/conferences/supernova1987a/ Orlando, S., et al. 2006 A&A, 457, 545; astro-ph/0607252. Zhekov, S.A., et al. 2005, ApJL, 628, 127. Acknowlegements This work was supported by NASA through SAO contract SV3-73016 to MIT for Support of the Chandra X-Ray Center (CXC) and Science Instruments; the CXC is operated by the Smithsonian Astrophysical Observatory for and on behalf of NASA under contract NAS8-03060.