Download
1 / 49
490 likes | 679 Views
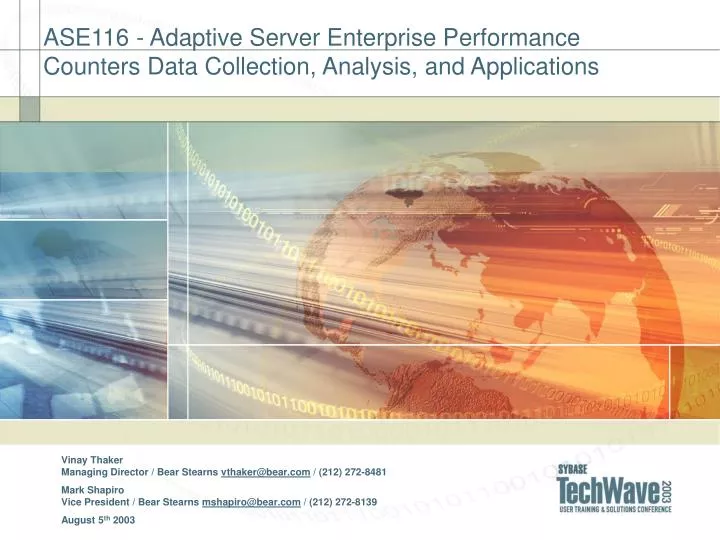
ASE116 - Adaptive Server Enterprise Performance Counters Data Collection, Analysis, and Applications. Vinay Thaker Managing Director / Bear Stearns vthaker@bear.com / (212) 272-8481 Mark Shapiro Vice President / Bear Stearns mshapiro@bear.com / (212) 272-8139 August 5 th 2003. Outline.

E N D
ASE116 - Adaptive Server Enterprise Performance Counters Data Collection, Analysis, and Applications Vinay ThakerManaging Director / Bear Stearns vthaker@bear.com / (212) 272-8481 Mark ShapiroVice President / Bear Stearns mshapiro@bear.com / (212) 272-8139 August 5th 2003
Outline • Performance Monitoring • Application Architecture • Data Model • Case Studies • Complexity Factor Model • Proactive Monitoring • Data Warehousing
Performance Challenges Background • Problems Typically Happen In Dynamic Environment • Data • Application • Version • Operating System • Hardware • Tougher Problems Are In Static Environment • Statistics • Index Selection • Usage Pattern • Slow Creep
Performance Solutions Self Tuning Servers
Performance Solutions Tools
Tools Performance Monitoring Tools • sp_monitor, sp_who, sp_lockinfo etc. • Home grown stored procedures • Monitor Server • History Server • Monitor Client Library • sar, vmstat, iostat, mpstat • Network Sniffers • Enterprise Monitoring Tools
Tools Contd. sp_sysmon architecture • Exposes the same set of counters as monitor server • No additional components on the DataServer • Output format is a report • Consists of 4 main stored procedures and approximately 15 other supporting stored procedures • sp_sysmon validates input parameters and calls other procs • sp_sysmon_collect clears the counters waits for the designated time and then collects the counters into temporary table • sp_sysmon_analyze calls subordinate stored procs to print out sections of the report • sp_sysmon_kernel, sp_sysmon_memory, sp_sysmon_locks are examples of low level procedures which print out sections of the report
Requirements • Historical Depth • Should have ongoing collection with 1 month of historical depth to the data • Historical data should be in a format capable of being analyzed easily • Near Real Time Data • Data should be available for analysis in realtime • Data should be comprehensive • Easy Access • Ideally have a browser based tool • Access to both the raw and aggregated counters • Charting tool for comparative analysis • Pro-active Monitoring • Data collection feeds rules engine • Global and server level rules • Alerts fed to notification engine
Data Model Core Tables
Data Model Aggregation Tables
Data Model Complexity Factor Tables
Data Volumes Core Tables • Over 250 servers • DBCC commands produce roughly 5000 counters • On certain servers this can be as high as 30,000 • Currently collect data uniformly across all servers on a 10 minute interval • Translates to 2100 counters/sec • Delivery daemon handles 2500 counters/sec/thread • Derived data table averages 750,000 rows per day • Raw data table averages 180 million rows per day
Data Collection Java Daemon • Multi-threaded • Collects data from over 250 ASE servers • Server version ranges from 11.0.3.3 to 12.5.X • JDBC calls to the ASE • Stripped down version of sp_sysmon • Multiple result sets are returned back by the proc • Uses JNI & CT-lib to serialize the resultsets into ASE • Uses features of Java 1.4 to do direct memory I/O from Java to the ‘C’ library • Writes data into temporary tables • Delegates data processing to a stored proc • Asynchronous reader – writer paradigm • Runs ~ 24x7 with a small maintenance daily window
Data Processing Sample Processing • Sybase Approach • ASE currently publishes over 200 counters • Raw output produced from the DBCC commands ranges in 10k-20k range • Logic to process derived counters from raw spread across 15 stored procedures. • Logic defers across versions • Our Approach • Rules driven derivation • 90% of the rules represented as rows in a table • Rest embedded in the stored procedure • Set of stored procedures handle all versions • Processes 20k rows in 2.5 seconds • Populates raw and derived sets of table
Data Aggregation Averaging in Sysmon • Weight based averaging • Hourly Average • Market Open • Market Close • Business Day • Daily Average • Multi-day Average • Moving Average
Counters • Sybase exposes a large number of counters • 10% get used 90% of the time • Versioning • Counters vary across versions • New counters get introduced • Bugs get fixed • Consistency • Certain counters produce a total value and a miscellaneous bucket is computed • Certain counters compute the total value • CPU is always used as a % of the time • We produce additional derived counters • Simple Aggregation - Total I/O = Reads + Writes across all disks • Ratios - Cache Efficiency = Cache Hits / Cache Misses • Complex Aggregation – Index Utilization = ( (Non-clustered Maintenance) + (Page Splits) ) / Index Scans
Case Study 1 VWAP Trade Ware Problem Analysis • Problem Summary • Slowness was reported on the VWAP Trade Ware server during 11:10 to 11:20 on 3/13/2003 • Problem Analysis • Checked the overall health of the server • Verified transaction log conditions • Checked Sybase error log • Had UNIX system administrators & network administrators run a check • Resolution • Server condition is normal
Case Study 1 VWAP Tradeware Problem Analysis Average CPU utilization during that time. Relatively High as compare to samples prior to the event but in line with sample at various other time.
Case Study 1 VWAP Tradeware Problem Analysis No heavy blocking activity recorded. Lock contention within the expected range as per the normal server load.
Case Study 1 VWAP Tradeware Problem Analysis Sybase engine performs Network IO blocking checks when, Sybase engine has no tasks to process in its run queue. Sybase engine is polling the port for Network I/O for either new request to be processed or an acknowledgement on results sent back to the users.
Case Study 1 VWAP Tradeware Problem Analysis During that period number of bytes received dips.
Case Study 1 VWAP Tradeware Problem Analysis Bytes sent dips too.
Case Study 1 VWAP Tradeware Problem Analysis No network I/O delayed. This indicates that there were no outstanding packets to be sent during that time.
Case Study 1 VWAP Tradeware Problem Analysis • Conclusions • Blocking network check and related indicators are not in line with the long term trend • Sybase engine is waiting for network I/O • Since business activity was normal at that time, but, both bytes received and bytes sent dips during this period point to slowness on handling the network request • There were no outstanding packets to be sent because there were no network delays recorded • Network was not able to deliver the new requests to the Sybase engine resulting into users getting database not responding impression
Case Study 2 Server Consolidation • Problem Summary • Do we have enough room to add one more ASE instance to a production host • Hardware Analysis • Gather Host configuration • Gather Network configuration • Gather Storage configuration • Counter Analysis • Gather 6 month performance data • Analyze daily average and trend • Analyze peak utilization and pattern of peak utilization
Complexity Factor Database Management • Managing Operational Database Environment • Periodic preventative maintenance (DBCC, Index Rebuilds, Backup, Update Statistics etc) • Change management (Provisioning/Decommissioning DataServers, Adding users, databases tables etc) • Manage cost (Hardware, Backup, Storage, Network, Software, License, Personnel, Projects etc) • Manage technological evolution (Hardware/Software Technology Changes, Technology & Architectural Shifts etc) • Day To Day Operational Management • Typically focuses on periodic preventative maintenance & change management • Typically focuses on managing a few parameters • Need For Tools • To manage large number of parameters across a large universe of servers • Play out “What If Scenarios” • Historical data for trend analysis • Near real time data
Complexity Factor Current Approach • PPS Model • Products, Projects & Services • Defines Four Fixed Cost Products With Specific SLO • Platinum (24x7) • Gold (24x6) • Silver (24x5) • Bronze (12x5) • Custom (Roll your own) • Advantages • Provides a simplistic model for charge back • Disadvantages • Insurance Model vs Usage Model Play out “What If Scenarios” • Manages environment on a few set of parameters
Complexity Factor Proposed Approach • Complexity Factor Model • Weighted – Linear combination of a set of parameters • Relative – Measure of a server in relation to a universe • Aggregate - Means to aggregate disparate parameters • Dynamic – Self adjusting standard deviation normalization • Multiple – Models can be created by varying weights, components and groups • Easy - Sophisticated quantitative model but end product is easy to understand and use • History of Development • Sybase performance counters data collection project • Over 200 disparate parameters • DBA’s typically manage 10-20 parameters • Complexity Factor model is used to generate management reports from underlying data • Metrics • Performance counters • Hardware characteristics • Time spent on change management tickets • Frequency of alerts & outages • Rate of change in environment
Complexity Factor Simplistic Example
Complexity Factor Normalization Problem • Two Different Problems In Comparing Weighted Linear Combinations of Parameters • Different Scales - Average values can range from 0.1 (number of deadlocks) to 10,000,000 (bytes sent & received over the network) • Different Widths - Width as a measure of standard deviation of the parameter distribution can range widely from 0.1 to 10 • Direct linear combinations of such varied parameters is not possible • Non-linear transformations or weight based normalization does not help • Goal is to transform measured parameters to allow direct comparisons and manipulations • Transformation should not change the shape of the distribution of a parameter • Can still use weights to assign importance to parameters
Complexity Factor Normalization Solutions • Scale Normalization • Simple average based transformation • Y = X / average(X) • Average is calculated across the universe of servers • X is the value of the parameter before scale normalization and Y after • average(Y) = 1 • Width Normalization • Makes the standard deviation of all parameters in the model identical • Transformation preserves the momentum of the distribution • Z = average(Y) + K * (Y – average(Y)) • K is constant for a parameter across all servers but varies from parameter to parameter • Given that average (Y) = 1 • Z = 1 + K * (Y – 1) • K = L / standard_deviation(Y) • L is computed as the weighted sum of deviations of all parameters • Occasionally leads to negative values • Moving Average Normalization • Uses a moving average to do scale normalization • Used to study complexity factor trend
Complexity Factor Normalization Example
Complexity Factor Complexity Factor Model • Define Model • Define the objectives • Define Component Groups • Define the complexity tree • Component Groups are reusable • Define Components • Component should measure some well defined behavior • Monotonic dependency between component value and complexity factor • Stable over time • Define Component Data Source • Identify how the component will be measured • Identify data collection strategy • Typically uses weighted combination of all day average, business day average and histogram peaks • Define Weights • Identify dominant components and component groups • Start with equal weights and then use heuristic assignment • SLO Weight • Normalization • Scale Normalization • Width Normalization • Moving Average Normalization • Complexity Factor • Traverse tree and compute complexity factor
Complexity Factor Complexity Factor Tree
Proactive Monitoring Architecture • Near real time alerts • Monitor 10% of the frequently used parameters • Historical data to baseline • Threshold to eliminate noise • MQ replication • Rules Engine • Notification engine
Data Warehousing ASE IQ • Massive Data Volume • Historical Data Needs • Nightly Data Sync • Ad-hoc querying • OLAP • Cognos