Download
1 / 14
140 likes | 210 Views
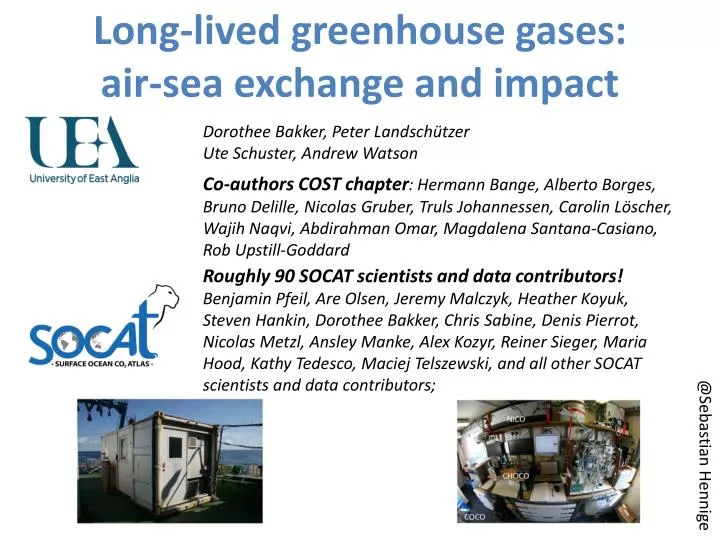
Long-lived greenhouse gases: air-sea exchange and impact. Co-authors COST chapter : Hermann Bange , Alberto Borges, Bruno Delille , Nicolas Gruber, Truls Johannessen , Carolin L öscher , Wajih Naqvi , Abdirahman Omar, Magdalena Santana- Casiano , Rob Upstill -Goddard.

E N D
Long-lived greenhouse gases: air-sea exchange and impact Co-authors COST chapter: Hermann Bange, Alberto Borges, Bruno Delille, Nicolas Gruber, TrulsJohannessen, CarolinLöscher, WajihNaqvi, Abdirahman Omar, Magdalena Santana-Casiano, Rob Upstill-Goddard Roughly 90 SOCAT scientists and data contributors! Benjamin Pfeil, Are Olsen, Jeremy Malczyk, Heather Koyuk, Steven Hankin, Dorothee Bakker, Chris Sabine, Denis Pierrot, Nicolas Metzl, Ansley Manke, Alex Kozyr, Reiner Sieger, Maria Hood, Kathy Tedesco, Maciej Telszewski, and all other SOCAT scientists and data contributors; Dorothee Bakker, Peter Landschützer Ute Schuster, Andrew Watson @Sebastian Hennige
Rapid increase in atmospheric contentof long-lived greenhouse gases Carbon Dioxide (CO2) Forster et al. 2007. IPCC
(IPCC, 2007; COST chapter, in review)
Oceanic N2O production by denitrification and nitrification (Suntharalingam and Sarmiento 2000) Arabian Sea 19°N 67°E (Naqvi 2008)
Upper ocean CH4 production Krey et al 2009 Forster et al. 2009 DSR2 (56): 964-976
CH4 hydrates & CH4 bubbles Recovered CH4 hydrate Expected CH4 hydrate (Krey et al 2009) • Large uncertainty CH4 hydrate inventory (O’Connor et al. 2010) ; • CH4 hydrates melt upon warming (Arctic Ocean!); • ~90% of CH4 released is oxidized to CO2 in water column; • Potential large short-lived effect from added GHG CH4 (Archer 2007); • Long-term effect (>1,000 years) from added CO2 GHG of similar magnitude as CO2 from fossil fuel use (Archer and Buffet 2005).
Impact of oceanic CO2 uptake • Net oceanic CO2 uptake reduces anthropogenic climate change. • Oceanic CO2 uptake reduces pH, [CO32-] and calcification, i.e. leads to ocean acidification. CO2 air-sea flux = k • K0 • ΔfCO2(water-air) fCO2 = γ • pCO2, γ ~ 0.997. (IPCC, 2007)
Decadal variation or long-term trend?A decrease in the North Atlantic CO2 sink from 1994/95 to 2002/05 3 2 Air-to-sea flux CO2 [mol m -2 year -1] 1 0 25 30 35 40 45 50 55 Average 1994/95 Average 2002/05 Latitude [oN] 1994/95 with 2002/05 temperature 2002/05 with 1994/95 wind speed CO2 sink (Schuster and Watson, JGR, 2007, doi:10.1029/2006JC003941)
Year-to-year variation in North Atlantic CO2 sink Watson et al. 2009 Science 326:1391-1393.
A North Atlantic pCO2observing network on VOS 2002-2004 (Cavassoo), 2005-2009 (CarboOcean), 2011-2014 (CarboChange), ICOS?
www.socat.info v1.5 public 14/09/11 Version 1.5
Surface Ocean fCO2 (v1.5) www.socat.info • 6.3 million fCO2 on 1851 cruises from 1968 to 2007. • fCO2 in uniform format with 2nd level quality control. • Transparent, fully documented. • Public with regular updates planned.
Data products www.socat.info January average (all years) 1) Global surface ocean data set of recalculated fCO2 in a uniform format with 2nd level quality control; 2) Individual cruise files of recalculated fCO2 (as 1); 3) Global gridded product of monthly surface water fCO2 means, with minimum interpolation. (Bakker et al. (2012) Eos 93(12): 125-126; Pfeil et al., in prep.; Sabine et al., in prep.; Left figure by Reiner Schlitzer – AWI.
Satellite SST, chl & winds help interpolate the network pCO2 data accurately, to create maps. CO2 mapping CO2 measurement network Spot pCO2 data (Slide courtesy of Andrew Watson; Telszewski et al. (2009) BG 6: 1405-1421)