Download
1 / 24
240 likes | 530 Views
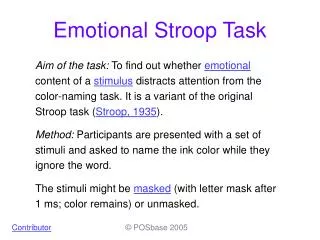
SAfety VEhicles using adaptive Interface Technology Phase 1 Research Program Quarterly Program Review. Task 2: Driving Task Demand Task Leaders: David Eby (2a) Paul Green (2b). Task 2: Driving Task Demand. Objectives:

E N D
SAfety VEhicles using adaptive Interface Technology Phase 1 Research ProgramQuarterly Program Review Task 2: Driving Task Demand Task Leaders: David Eby (2a) Paul Green (2b)
Task 2: Driving Task Demand • Objectives: • Review literature and crash databases to identify relevant datasets and factors important to driving task demand; Determine response time to a braking event as a function of workload/visual demand of driving as assessed by the visual occlusion method • Staffing: • 2a: Eby, Kostyniuk, research assistant • 2b: Green (1.45 m), Eby (0.5 m), grad (7.0 m) • Deliverables • Literature review (May, 2003) • Crash analysis report (Oct, 2003) • Task 2 report (Nov, 2003) • Schedule • Literature review (Mar-May, 2003) • Crash analysis (July-Sept, 2003 • Design simulator study (Mar-Jun, 2003) • Data collection (July-Aug, 2003) • Report (Sept-Oct, 2003) • Preliminary equations (Oct-Nov, 2003)
Task 2a: Driving Task Demand • Background • The level of attention required for safe driving is likely to be correlated with the level of demand (driving task demand) imposed on the driver by the driving environment • As the demand on driving increases, fewer attentional resources are available for non-driving tasks leading to a greater likelihood of crashing. • Crash databases have been selected as a possible data source for developing a surrogate measure of driving task demand. • Crash rates may be good indicators of the volatility or unpredictability of certain driving situations and are likely to correlate well with the amount of attention demanded by the roadway, traffic, and/or environment.
Task 2a: Driving Task Demand • Background, continued • Our approach is: • Determine crash rates by a number of factors related to road, traffic, and environment; • Relate a portion of these analyses to simulator results (Task 2b) on a similar variable. • Activities • Literature Review • Three purposes: • Determine driving task demand trends from literature on crash analyses; • Review human factors literature on the attentional demand of the road, traffic, and weather; • Assess crash databases for driving task demand analyses.
Task 2a: Driving Task Demand • Crash Database Study Literature • Working hypothesis: • Road locations and conditions of higher demand should have higher crash rates than locations with lower demand. • Nearly 60 year history of studies on crashes as a function of road, weather, and traffic. • This section focused only on a set of studies that have analyzed large databases. • The crash study section review focused on the following areas: • Roadway: Cross-section; horizontal/vertical alignment; access; and construction zones • Intersections • Weather • Traffic volumes
Task 2a: Driving Task Demand • Human Factors Literature • Considered only studies that have used the visual occlusion method to measure visual demand. • Categories: Curves; lane width; traffic density; weather; and driver. • Main findings: • Visual demand is inversely related to radius of curve; • Visual demand does not vary with deflection angle; • Visual demand rises at the end of the approach tangent, peaks at the beginning of a curve, and declines throughout the curve; • Visual demand is higher for s-curves than broken-back curves; • No data could be found for vertical curves; • Slight increase in visual demand with decreasing lane width; • Visual demand is slightly higher with on-coming traffic, but only on curves; • No visual occlusion studies on weather could be located; • Older drivers require more visual input than younger drivers; • Women drivers require slightly more visual input than men drivers; • All visual occlusion studies are influenced by driving speed.
Task 2a: Driving Task Demand • Database Assessment Review • Purpose was to assess which database was available and feasible for driving task demand analysis. • We reviewed the same databases here as in Task 1. • HSIS, which contains the best roadway, weather, and environment conditions, was selected as the best database for this task.
Task 2a: Driving Task Demand, continued • Activities, continued • Data Analysis • Purpose: Link crash data with simulator results (curves of various radii) • Purpose: Obtain crash rates on a wide range of roadway and environment factors. • Analysis plan • HSIS-Michigan data for 2 most recent years (1996-1997); • We have requested a variety of variables by road segment, intersections, and interchanges; • For these variables data for all crashes and crashes by weather conditions, lighting, and peak/nonpeak times of day; • Segmentation analysis will be conducted to partition data into exclusive and exhaustive subgroups; • These analyses will yield crash rates for the numerous categories of interest; • In effect, we will end up with a crash rate lookup table for use by the SAVE-IT system to estimate driving task demand; • If necessary, regression analysis on certain variables will be conducted; • Analyses of horizontal curves that match those simulated in Task 2b will be conducted to link crash rates to simulator results.
Task 2b: Driving Task Demand • Issues: 1. How does the response time to a braking event vary as a function of the workload/visual demand of driving as assessed by the visual occlusion method? 2. How does response time to a lead vehicle braking event vary as a function of the workload/visual demand or driving as assessed by ratings?
Task 2bDriving Task Demand • How could distraction problems occur? Case 1: Vehicle Initiated Event Q: When it is a bad time for the vehicle to interrupt the driver? (The incoming cell phone call, vehicle alert message problem) A: When the driver is too busy to do the task (because it is raining, in heavy traffic, etc.)? This can be addressed by examining when crashes, overall, are most likely to occur per unit of exposure.
Task 2bDriving Task Demand Case 2: Driver Initiated Event Q: When should the driver not initiate a difficult task? A1: When they overloaded at when the tasks starts (e.g., because of heavy traffic), which they may realize. A2: When they are moderately loaded but do not realize that the in-vehicle task will overload them. Aside: The CDS analysis shows that distraction crashes are relatively MORE likely in good driving conditions (e.g., clear weather, dry pavement).
Task 2bDriving Task Demand This means we need to assess the driving workload, in this instance using the visual demand method. 1. To drive, one must see. 2. How much one needs to see is an indicator of demand. 3. So, “when driving, close your eyes whenever you can.” 4. % open time indicates demand. 5. 100% open is high demand. 6. But recording eye closure is not easy (even with FaceLab) and there are tradeoffs between open and close times. 7. We have the subject push a button to get a 0.5 s glimpse of the road. Between glimpse periods, the screen is gray (the scene is not visible). 8. Recent versions of the DriveSafety support occlusion.
Task 2bDriving Task Demand • Critical to establish relationship between visual demand and RT • RT: strong face fidelity, but max of 1 RT per minute & with controls, -> probably only 30 RTs per subject. • With several reps within subjects -> few combos of conditions. • Also, repeated lead vehicle braking can induce motion sickness in older subjects, so the # RTs/subject should be minimized. • With visual occlusion, at 50% demand & 0.5 exposure duration, there is 1 response per second. Allowing for control conditions, that is 60 times the number of RTs, a much more efficient approach for assessment.
Task 2bDriving Task Demand How should people rate the risk of driving? • TLX is too arbitrary (and it measures workload). • The range scale problem (from prior UMTRI work). “I thought the last one was bad, but this is much worse. Unfortunately the scale goes to 10 and I called the last situation a 9.” • Solution: tie ratings to repeatable, real world anchors
Task 2bDriving Task Demand Rating As Risky As 10 Drive with my eyes closed, crash every time 9 Pass school bus - red lights flashing, stop arm extended. 8 Drive just under the legal alcohol limit, weaving 7 6 Drive 20 mph faster than traffic on expressway 5 4 Drive 10 mph faster than traffic on expressway 3 2 Drive - average road under average conditions 1 Drive - easy road, no traffic, pedestrians, etc. while alert
Task 2bDriving Task Demand • Activities: • Developed an experimental plan • Developed driving world & driving scenarios for UMTRI Simulator • Ran pilot subjects • Ran main experiment (16 subjects - 8 35-55, 8 65-75) • Protocol: Drive series of roads • baseline several times to get driving data, • baseline occlusion to get demand and driving data • get periodic subjective ratings of demand (overall) • as well as ratings for each characteristic • follow lead vehicle which brakes 1/min to get RT data (lead vehicle code is common to all experiments
Task 2bDriving Task Demand Practice Road “Square World”
Task 2bDriving Task Demand Test Road “Zig-Zag World” Balances l&r curves, curve radii, fog, etc.
Task 2bDriving Task Demand Due to a lack of time & resources, we could not collect all 8 cells
Task 2bDriving Task Demand Show clips • occlusion • braking event
Task 2bDriving Task Demand • Lessons learned from pilot subjects: 1. We continue to be impressed by how sensitive the visual occlusion method is to momentary changes in visual demand. 2. We need to be careful about how many braking events occur and how severe they are. Excessive braking could lead to motion sickness. 3. Braking of the lead vehicle in the test scenario is not easy to detect. 4. To stay within the 2 hour max per subject, some conditions will need to be eliminated. A 2-session experiment is not feasible within the schedule and cost.
Task 2bDriving Task Demand • Now reducing data from simulator experiment