Download
1 / 14
140 likes | 198 Views
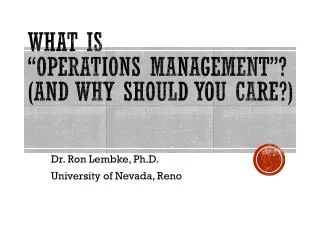
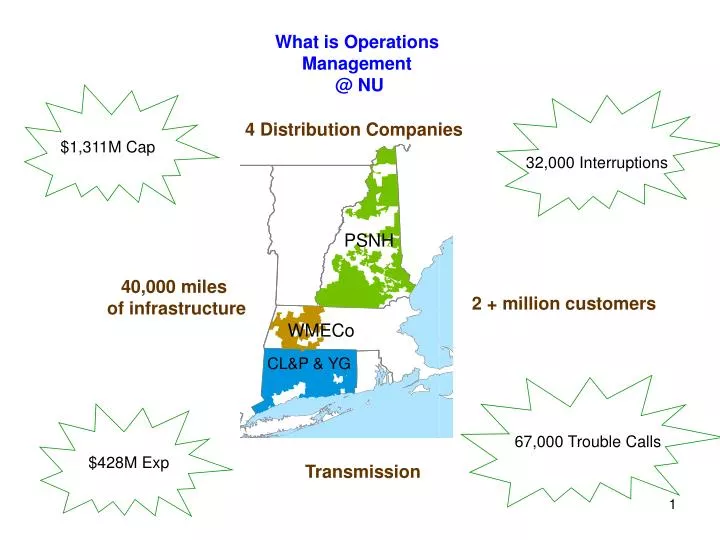
What is Operations Management @ NU. $1,311M Cap. 4 Distribution Companies. 32,000 Interruptions. PSNH. 40,000 miles of infrastructure. 2 + million customers. WMECo. CL&P & YG. 67,000 Trouble Calls. $428M Exp. Transmission. Diagram of Integrated Electric System.

E N D
What is Operations Management @ NU $1,311M Cap 4 Distribution Companies 32,000 Interruptions PSNH 40,000 miles of infrastructure 2 + million customers WMECo CL&P & YG 67,000 Trouble Calls $428M Exp Transmission
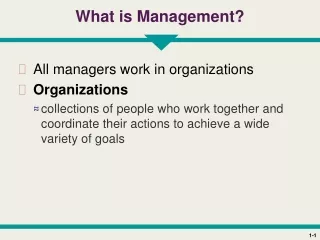
Diagram of Integrated Electric System Transformer12,500 – 25,000v Transmission Lines115,000 – 345,000 v Substation Electric Generation Distribution Lines2,400 to 34,500 v Residential User120 - 240 v Commercial User120 – 480 v Industrial User120 – 34,500 v
Key Macro-Level Operations Management Functions @ NU Planning Engineering Design Maintenance Customer Service Construction Operations • Many other support/logistics functions help make this work e.g…… • Purchasing/inventory/stores • Human Resources • Accounting • IT • etc., etc.
Key Operations Management Terminology Peak Demand (kW) Customer Usage (kWHr) Delivery Efficiency Delivery Cost Delivery Revenues Capital Operations and Maintenance Expense Customer Satisfaction
How Does Operations ManagementFit Into NUBusiness/Financial Model ? Revenues - Expenses = Net Income Operations Management Sales X rates PSNH & WMECo + + “other” - = YG + CL&P + Transmission Operations Expenses Maintenance Expenses Capital Expenses Other Expenses
NU Uses Operational Performance Indicators (KPIs) to Measure and Drive Operations Management • High level KPIs are consistent across Operating Companies • 4 Main Areas of Focus • Safety • Operations • Customer • Financial • Total of 71 KPIs • Targets set annually …. results reviewed monthly • Lower level KPIs exist with Operating Companies and functions • Short term and long term corrective actions expected where performance falls below targets.
NU Operational KPIs/February 2008 CL&P Yankee WMECo PSNH Transmission Utility Services Consolidated
Strategic Priority An Individual KPI (i.e. SAIDI)
Each Year “Operational Plans” are Developed and Executed at NU by Operating Company/Business Unit to Manage Operations Performance 5 Year Enterprise Plan 1 Year Operational Plan Execution of Operational Plan • Spring development • 5 Year focus • Strategic/major initiatives • 5 year initiatives to • identify major risks • address business environment changes • major KPI trend issues • Fall development • “Next Year” focus • Compatible with 5 year Enterprise Plan • Tactical • Set Operational KPIs • Initiatives to achieve KPIs
Major Events & Changes for Electric Utilities in New England/Last 50 Years Energy Efficiency Emphasis Power Pool Development/FERC Influence Intensified “D” regulation Mostly stand alone utilities M & As Nuclear Construction No Nuclear Construction Integrated G & T planning T planning only Changes in Utility Environment Vertically integrated utilities Utilities Segmented ? Dropping energy costs Rising energy costs High sales growth Low sales growth Year 1955 1965 1967 1973 1979 1985 1990 2003 2008 Major Events Northeast (NU Oil 3 Mile Hurricane Hurricane Northeast Global Blackout 1 Formed) Embargo Island Gloria Bob, Blackout 2 Warming/ Restructuring RGGI
So ….. Operations Management Areas of Focus Have Had to Change With The Times (1955 – 2008) • Adapt to growing influence of power pools and FERC • Adapt to lack of integrated generation and transmission planning • Cope with increasing regulation (especially D segment) • Higher total energy costs = higher customer expectations • Manage an aging infrastructure (post WWII expansion) • Control delivery costs to offset higher energy costs and slower revenue growth • Take the lead in energy efficiency • Become “players” in legislative/regulatory decisions
Key Operations Management Challenges Facing Distribution Utilities Today • Safety • Meeting increasing customer performance expectations • Managing an aging distribution delivery infrastructure • Managing increasing costs between rate cases • Managing areas of environmental risk • Planning for worker attrition • Reacting to changing laws and regulations • The goal is to accomplish items above while meeting Shareholder expectations for increased income over time