Download
1 / 43
550 likes | 1.07k Views
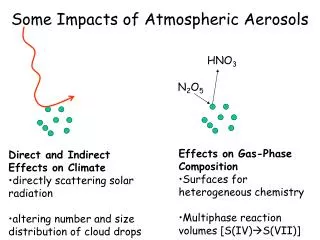
PRACTICAL CONSEQUENCES OF THE SCHWARZSCHILD EQUATION FOR RADIATION TRANSFER WHEN SCATTERING IS NEGLIGIBLE. From Grant Petty’s Book, A first course in Atmospheric Radiation. Atmosphere Emission Measurements, Downwelling Radiance. Notes: Wavelength range for CO2, H20, O3, CH4.

E N D
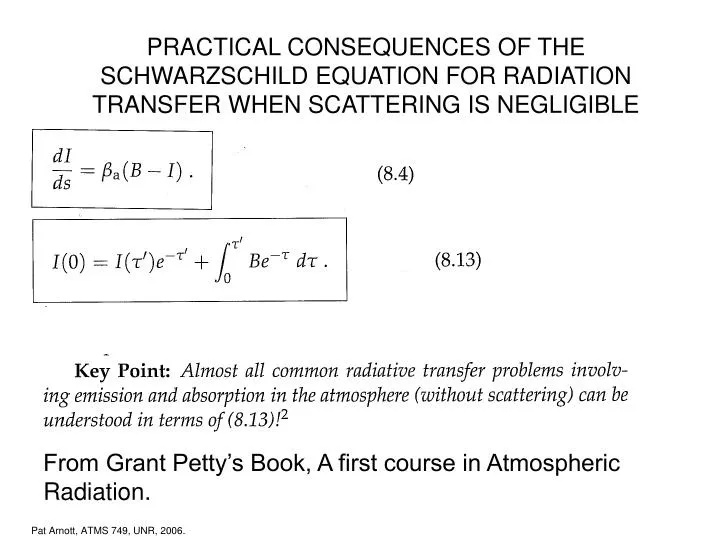
PRACTICAL CONSEQUENCES OF THE SCHWARZSCHILD EQUATION FOR RADIATION TRANSFER WHEN SCATTERING IS NEGLIGIBLE From Grant Petty’s Book, A first course in Atmospheric Radiation.
Atmosphere Emission Measurements, Downwelling Radiance Notes: Wavelength range for CO2, H20, O3, CH4. Envelope blackbody curves. Monster inversion in Barrow. Water vapor makes the tropical window dirty.
Comments on Figure 8.3. The very strong CO2 line at 15 microns typically gives the gas temperature closest to the FTIR spectrometer.
FTIR Data from the NASA ER2 with Responsible Gases labeled. IR Window 8-13 microns. IR radiation from the Earth’s surface escapes to space (cooling the Earth). Absorption by O3 near 9 microns ‘dirties’ the window. (From Liou, pg 120).
Weighting Functions for Satellite Remote Sensing using the strong CO2 absorption near 15.4 microns. (from Wallace and Hobbs, 2nd edition)
Atmospheric Temperature Profile: US “Standard” Atmosphere. Cirrus cloud level. High cold clouds, visible optical depth range 0.001 to 10, emits IR to surface in the IR window. From Liou
Cirrus Clouds: Small Crystals at Top, -40 C to -60 C nucleation Growth and fall Evaporation
FTIR Data from the NASA ER2, Clear and Cloudy Sky. (From Liou’s book). The ice cloud with small ice crystals has emissivity << 1, so the ground below is partially seen. Clouds reduce the IR making it to space in the atmospheric window region. IR Atmospheric window region
Ice Refractive Index Red shows the atmospheric window region. The resonance in the window region is useful for remote sensing. The real part goes close to 1, making anomalous diffraction theory a fairly reasonable approach for cross sections.
Cloud Emissivity in General and Zero Scattering Approximation.
Cirrus with Small Crystals IR Transmission Model Message: Curve has basic shape of the IR spectrum for small cirrus, primarily a transmission problem of ground radiance through the cloud, with a small emission correction. ASSUMES ZERO SCATTERING.
Cirrus with Small Crystals IR Emission Model Message: Curve has basic shape of the IR spectrum for small cirrus, primarily a transmission problem of ground radiance through the cloud, with a small emission correction.
IR Cooling Rates(from Liou) Message: Clouds are good absorbers and emitters of IR radiation. MLS is a moist midlatitude profile, SAW is a dry subarctic winter profile. Cooling rate is from the vertical divergence of the net irradiance absorbed and emitted.
Dances of the Molecules in the Atmosphere: Which dance? Depends on temperature, available IR photons. From Liou
Atmospheric Temperature Profile: US “Standard” Atmosphere. Dances of the Molecules in the Atmosphere: Which dance? Depends on temperature, available IR photons. From Liou
Line Strength Temperature Dependence Summary *** Energy levels are determined from quantum mechanics, electronic, vibration, rotation etc, as related to molecular mass, charge distribution, orientation, number of atoms, etc. *** # of molecules in each state is determined from statistical mechanics, partition function, thermal energy. Is there sufficient thermal energy to populate the energy levels above the ground state? What is the probability molecules are in a given energy state?
Some Energy States of Water Molecules http://www.lsbu.ac.uk/water/vibrat.html http://en.wikipedia.org/wiki/Libration
Is it likely that a molecule can be in energy state El?Water Vapor must be in state El before it can absorb photon with energy h0c.Molecules are in lower energy states at lower temperature.
Number of Lower Energy States for Water Molecules in Wavenumber bins for the Wavenumber Range 500-750 cm-1.
Line Strength Temperature Dependence Water Vapor: Strong Line
Electronic, Vibrational, energy levels and the big break up (dissociation level) From Liou
Absorption cross sections of O3 and O2 in the UV and Visible. Strongly affects atmospheric chemistry, thermal structure, and amount of deadly UV that doesn’t make it to the surface.
Depth for abs=[Babs (Ztoa-H)]=1 as a function of wavelength, and the gases responsible for absorption. H (km)
Classical Stratospheric Ozone Theory of Chapman (1930) (from Liou)
Solar Spectrum, Top of the Atmosphere and at the Surface Shaded region is solar irradiance removed by Rayleigh scattering and absorption by gases as indicated. (from Liou).
ERBE View of the radiation story (Wallace and Hobbs CH4) Note the IR cold spots near the Equator and the cold poles.
Color, texture, scattering in the visible…. See student pictures also….
Light Scattering Basics (images from Wallace and Hobbs CH4). Angular Distribution of scattered radiation (phase function) x x Sphere, radius r, complex refractive index n=mr + imi Dipole scattering x x mr=1.5 x Qs x
Geometrical Optics: Interpret Most Atmospheric Optics from Raindrops and lawn sprinklers (from Wallace and Hobbs CH4) Rainbow from raindrops Primary Rainbow Angle: Angle of Minimum Deviation (turning point) for rays incident with 2 chords in raindrops. Secondary Rainbow Angle: Angle of Minimum Deviation (turning point) for rays incident with 3 chords in raindrops.
Geometrical Optics: Rainbow (from Petty) x Angle of minimum deviation from the forward direction. Focusing or confluence of rays. Distance x is also known as the impact parameter. (Height above the sphere center.)
Geometrical Optics: Interpret Most Atmospheric Optics from Ice Crystals (from Wallace and Hobbs CH4) 22 deg and 45 deg Halos from cirrus crystals of the column or rosette (combinations of columns) types. Both are angle of deviation phenomena like the rainbow. Crystal orientation important. 22 deg halo, more common, thumb rule to measure size of arc.