Download
1 / 19
190 likes | 300 Views
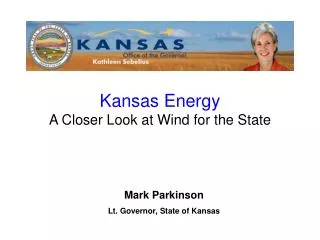
Climate Change Climate Change Impacts on Kansas. Mark Parkinson Lt. Governor, State of Kansas. Source: Washington State Department of Ecology.

E N D
Climate Change Climate Change Impacts on Kansas Mark Parkinson Lt. Governor, State of Kansas
Until 1750 and the Industrial Revolution, carbon dioxide measured in parts per million (ppm) never exceed 275. However since that time the rate of increase is approximately 2 ppm/year and is now over 380 ppm. You can see a direct correlation between the increase in temperature and increase in the amount of carbon dioxide in the atmosphere. Source: IPCC Working Group 1
Current Change: Coastal Glaciers are Retreating Muir Glacier, Alaska, 1941-2004 August 1941 August 2004 NSIDC/WDC for Glaciology, Boulder, compiler. 2002, updated 2006. Online glacier photograph database. Boulder, CO: National Snow and Ice Data Center. Source: John P. Holden, Harvard
Current Change: Coastal Glaciers are Retreating Mountain glaciers are Shrinking Qori Kalis Glacier, Peru Source: John P. Holden, Harvard
What’s Wrong With This Picture? Since 1979, more than 20% of the polar Ice Cap has melted away. ARCTIC SEA ICE BOUNDARY IN 1979 PHOTO: NASA
Tangible effects: Sea Levels Siberian lakes shrink as the Arctic permafrost beneath them melts IPCC estimates that the global average sea level will rise by 7.2 to 23.6 inches by 2100. Satellite images: minimum levels of Arctic sea ice in the summers of 1979 (left) and 2005 demonstrate warming trend. (Futurist Magazine)
Surface melting on Greenland is expanding In 1992 scientists measured his amount of melting in Greenland as indicated by red areas on the map Ten years later, in 2002, the melting was much worse And in 2005, it accelerated dramatically yet again Source: ACIA, 2004 and CIRES, 2005
Temperature Change Kansas could experience a winter increase in average temperatures of 5 degrees F and a summer time increase of approximately 10 degrees F. Source: IPCC
a) Precipitation Change c) b) Source: IPCC
Why it matters to Kansas… positive effects with carbon mitigation
Kansas Wind Projects – In operation and announced WIND PROJECT (County) DEVELOPER UTILITY SIZE YEAR_______ Jeffery Energy Center (Pottawatomie Co.) Westar Westar 1.5 MW 1999 Gray County Wind Farm (Gray Co.) FPL Energy Aqula 112.2 MW 2001 Elk River Wind Facility (Butler Co.) PPM Energy Empire 150 MW 2005 Spearville Wind Energy Facility (Ford Co.) enXco KCP&L 100.4 MW 2006 TOTAL INSTALLED AT END OF 2007 364.1 MW Smoky Hills Wind Farm (Lincoln Co.) Tradewind Sunflower 50.4 MW 2008 (1st Qtr) KC BPU 25 MW 2008 (1st Qtr) Midwest 25.2 MW 2008 (1st Qtr) Meridian Wind Farm (Cloud Co.) Horizon Empire 105 MW 2008 (4th Qtr) Westar 96 MW 2008 (4th Qtr) Flat Ridge Wind Farm (Wichita Co.) BP Alternative Energy Westar 100 MW 2008 (4th Qtr) Central Plains Wind Farm (Barber Co.) RES America Dev, Inc Westar 99 MW 2008 (4th Qtr) TOTAL INSTALLED AT END OF 2008 864.7 MW KCP&L Announcement (3/20/07) RFP was due 6/15/07 KCP&L 300 MW 300 MW by 2012 Updated by KCC Energy Programs (Jan 2008)
Economic Impacts to Kansas from 7158 MW of new wind development by 2030 Source: NREL – Wind Powering America Wind energy’s economic “ripple effect” • Direct Impacts • Payments to Landowners: • $20.8 million/year • Local Property Tax Revenue: • $19 million/year • Construction Phase: • 11,133 new construction jobs • $1.35B to local economies • Operational Phase: • 1805 new long-term jobs • $152M/yr to local economies • Indirect Impacts • Construction Phase: • 5,000 new jobs • $424M to local economies • Operational Phase: • 438 local jobs • $43 M/yr to local economies • Induced Impacts • Construction Phase: • 6,223 new jobs • $559 M to local economies • Operational Phase: • 850 local jobs • $76 M/yr to local economies Totals (construction + 20 yrs) Total economic benefit to Kansas = $7.8 billion New local jobs during construction = over 23,000 New long-term jobs for Kansans = over 3,000 Construction Phase = 1-2 years Operational Phase = 20+ years
Thank You Lieutenant Governor Mark Parkinson