Download
1 / 28
320 likes | 484 Views
Climate Hotspots Mapping: What Have We Learned?. Alex de Sherbinin Senior Staff Associate Center for International Earth Science Information Network (CIESIN) The Earth Institute at Columbia University Deputy Manager NASA Socioeconomic Data and Applications Center (SEDAC) ICARUS III

E N D
Climate Hotspots Mapping: What Have We Learned? Alex de Sherbinin Senior Staff Associate Center for International Earth Science Information Network (CIESIN) The Earth Institute at Columbia University Deputy Manager NASA Socioeconomic Data and Applications Center (SEDAC) ICARUS III 18 May 2012
Outline • What is a hotspot? • Why map hotspots? • Preliminary meta-analysis of hotspots mapping efforts • Lessons learned and issues
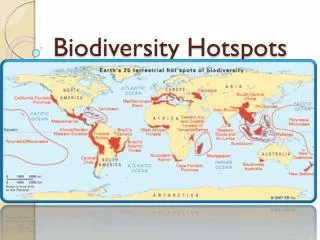
What is a hotspot? • Term derived from early work by Norman Myers to identify areas at risk of biodiversity loss • Wikipedia: “A biodiversity hotspot is a biogeographic region with a significant reservoir of biodiversity that is under threat from humans” The original hotspots map Source: Myers, N. 1988. Threatened biotas: “Hot spots” in tropical forests. The Environmentalist 8 187-208.
What is a climate change hotspot? • Integrates spatial variability in: • Climate or biophysical systems • Human pressures or vulnerabilities • Climate change impacts are spatially differentiated • Vulnerabilities are spatially differentiated • Adaptive/coping capacities are spatially differentiated Drought Frequency Poverty Levels Land Cover Map Mapping can illuminate key vulnerabilities in the coupled human-environment system and, in turn, inform where adaptation may be required Societal Impacts
Why map hotspots? • At a time of increasing pressure on donors and development organizations to show that scarce public resources are being used in a responsible manner, spatial indicators and hotspots maps hold the promise of transparent and, more importantly, “scientific” and defensible priority setting • “Enhancing disaster-risk reduction before a disaster occurs, and also during the reconstruction process, requires enhanced knowledge regarding the most vulnerable groups, the areas at risk and the driving forces that influence and generate vulnerability and risk.” Birkmann 2007 • Hotspots maps are also developed to raise awareness among the general public and high-level policy audiences • The actual goals generally differ depending on the project
Methodology • This paper focuses on hotspots analyses that: • Are at global or regional scales • Are not national scale indicators • Examples of the latter include Yohe et al. 2006., Wheeler 2011, and Population Action International 2011 • Summarized efforts according to purpose, audience, analytical framework, methods, and hotspots identified • The work is preliminary and feedback is very welcome!
Mapping methods and themes • Climate scenarios • GIS data integration • Creation of spatial indicators and indices • Use of GIS data to tell a story • Expert judgment (free hand mapping) Common caveat: “Given the extreme complexity of climate change and human vulnerability, this study should be considered as indicative only. We have taken a pragmatic approach in order to produce useful results and analysis within the scope and resources of this project.” – Thow & de Blois 2008
IPCC Working Group 2 Definition of Vulnerability • Population’s Vulnerability = f (E, S, A) • Where • E = exposure— size of the area and/or population affected (does the event occur there?) • S = sensitivity — the intrinsic (age, sex, SES, ethnicity, livelihood strategies, etc.) and extrinsic (institutions, entitlements, etc.) characteristics of a population • A = adaptive capacity— capacities of the population, place or system to resist impacts, cope with losses, and/or regain functions “Vulnerability is the degree to which a system is susceptible to, or unable to cope with, adverse effects of climate change, including climate variability and extremes. Vulnerability is a function of the character, magnitude and rate of climate change and variation to which a system is exposed, its sensitivity, and its adaptive capacity.”
Type 1. Regional Climate Change Index • A relative indicator of change in precip and temp from 1960-79 to 2080-99 • Based on multi-model ensembles for A1B, B1, and A2 scenarios Source: Giorgi, F. 2006. Climate change hot-spots, Geophysical Research Letters, 33, L08707
Type 2a. Humanitarian implications of climate change • Uses combination of historical country-level data (refugees/displace-ment, conflict) and CIESIN’s gridded data for population, poverty and climate hazard exposure • Climate scenario data (A1B) for: % change in extreme precip, % change in maximum dry periods, and future dynamics of drought risk Source: CARE and Maplecroft. 2008. Humanitarian implications of climate change: Mapping emerging trends and risk hotspots. Geneva, Switzerland: CARE International.
Type 2a. Vulnerability profiles in drylands Uses integrated assessment modeling to answer questions: • What are main exposures, vulnerable groups and their sensitivities? • What are V creating mechanisms? • Where do they manifest? • How will future changes affect wellbeing? • What coping/ adaptation responses are possible? Source: Kok, M.T.J., M.K.B. Lüdeke, T. Sterzel, P.L. Lucas, C. Walter, P. Janssen and I. de Soysa. 2010. Quantitative analysis of patterns of vulnerability to global environmental change. Den Haag/Bilthoven, Netherlands: Netherlands Environmental Assessment Agency (PBL).
Type 2a. Climate change vulnerability mapping in Southeast Asia Applies IPCC framework. Uses proxies for exposure (climate hazards), sensitivity (population and PAs), and adaptive capacity (HDI, poverty, income inequality, electricity coverage, irrigated area, road density, and communications infrastructure) Source: Giorgi, F. 2006. Climate change hot-spots, Geophysical Research Letters, 33, L08707
Type 2a. Climate change and African political stability Four baskets of vulnerability are identified: exposure to climate hazards, population density, household and community resilience (health, education, access to health care), and governance and political violence (country level indicators of government responsiveness, effectiveness, polity, and violence against civilians) Source: Busby, J.W., T.G. Smith, and K.L. White. 2011. Locating Climate Insecurity: Where are the most vulnerable places in Africa? Climate Change and African Political Stability Program Policy Brief No. 3.
Type 2a. Risk and vulnerability mapping in Southern Africa • Combines exposure (climate hazards such as droughts, floods, rainfall variability), future exposure (ensemble climate model precip, temp change and SLR), sensitivity (irrigated lands, crowding on agricultural lands, length of growing period, soil degradation, etc.), and adaptive capacity (night-time lights, education, malaria index, HIV prevalence, accessibility, etc.) • Climate impacts Source: Davies, R.A.G., and S.J.E. Midgley. 2010. Risk and Vulnerability Mapping in Southern Africa: A Hotspots Analysis. Cape Town, South Africa: OneWorld Sustainable Investments (Pty) Ltd.
Type 2b. Climate-migration hotspots Source: Warner, K., C. Erhart, A. de Sherbinin, S.B. Adamo, T.Chai-Onn. 2009. In search of Shelter: Mapping the effects of climate change on human migration and displacement. Bonn, Germany: United Nations University, CARE, and CIESIN-Columbia University.
Type 2b. Climate-migration hotspots Source: Warner, K., C. Erhart, A. de Sherbinin, S.B. Adamo, T.Chai-Onn. 2009. In search of Shelter: Mapping the effects of climate change on human migration and displacement. Bonn, Germany: United Nations University, CARE, and CIESIN-Columbia University.
Type 2b. Sea level rise displacement Source: McGranahan, G., D. Balk and B. Anderson. 2007a. The rising tide: assessing the risks of climate change and human settlements in low elevation coastal zones. Environment & Urbanization 19(1): 17-37. .
Type 3. Security risks associated with CC Source: Schubert, Schellnhuber, et al. 2007. Climate Change as Security Risk. London: Earthscan.
Type 3. CC and Political Instability Hotspots Source: Scheffran J & Battaglini A (2011) Climate and conflicts: the security risks of global warming. Regional Environmental Change 11(Suppl 1):S27-S39.
Type 3. Climate refugee hotspots Deltas Small Islands Coastlines under threat Desertification and Drought Hurricanes Arctic areas with permafrost melt Source: Emmanuelle Bournay, UNEP-GRID Arendal, Fifty million climate refugees by 2010 http://www.grida.no/graphicslib/detail/fifty-million-climate-refugees-by-2010_71db
Hotspots mapping: Data issues • Uncertainties in climate scenarios • Coarse resolution of climate models (AR5 may improve on this) • Uncertainties in emissions scenarios and climate sensitivity • Limited ability to capture extremes in temp or precipitation • Uncertainties and other issues with non-climate data • Temporal inconsistencies (regular remote sensing observations and future climate projections vs. “static” socioeconomic data) • Inconsistent definitions or measurements across countries • Spatial and scale mismatches (coastlines/boundaries) • Non-existent or inappropriate data • Reuse for other purposes may lead to unexpected problems • Data may exist but be too costly or poorly documented to use Hotspots mapping efforts generally extrapolate from current vulnerability to climate variability and extremes to identify how climate change mayalter the climate component, leaving aside changes in systems, sectors and groups that will be impacted
Hotspots mapping: Other issues • In GIS analysis, combinations of country-level, subnational and continuously varying variables such as precipitation leads to disjuncture at national borders • There is little ability to compare results because each effort is focused on different dependent variables (e.g. migration, conflict, agriculture) • The maps can tell a useful story, but as with any indicators, if results do not conform to the policy maker’s own mental models, they may not be widely accepted
Concluding Thoughts (1) • Hotspots mapping is characterized by methodological diversity • Data limitations mean that most authors characterize the work as “preliminary” or “broadly indicative” • There are many assertions that the results are policy relevant • Yet, there is little evidence that the hotspots maps are actually being used for prioritization of adaptation funding • Some mapping efforts are funded by donors, so they may be using the maps internally
Concluding Thoughts (2) • Like most indicators, they contribute to the framing issues: • “Scientific assessments, evaluations, scenarios and the like often influence policies indirectly and through largely unforeseen pathways, e.g. by gradually shaping frameworks of thought.” (POINT 2011: 7) • “indicators also represent particular ways to conceptualize problems and solutions. Indicators are not merely technical or “innocent” instruments for stronger surveillance and reporting. They are also elements in what has been termed as a political struggle over the contents of the process of ‘ecological modernization’ of society.” (Gudmundson 2003, Hajer 1992)