Download
1 / 10
100 likes | 395 Views
Production Possibilities Curve. Graphs to show alternative ways to use an economy ’ s productive resources. Production Possibilities. Economists will use graphs to analyze choices and trade-offs people make. Why? Graphs help us understand how one value relates to another value.

E N D
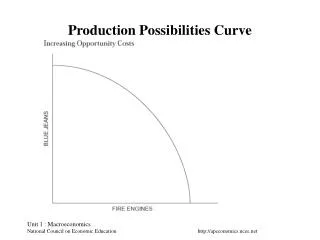
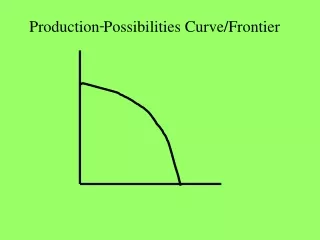
Production Possibilities Curve Graphs to show alternative ways to use an economy’s productive resources
Production Possibilities • Economists will use graphs to analyze choices and trade-offs people make. • Why? • Graphs help us understand how one value relates to another value. • Graphs- logical representation of figures • Axes of graphs chart categories and facts
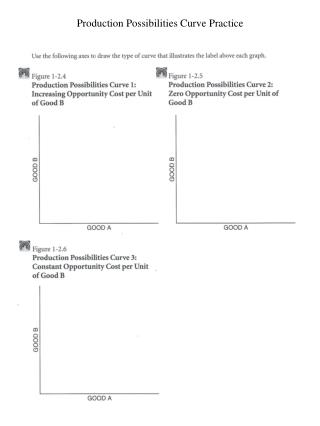
Drawing a Production Possibilities Curve • 1. Must decide which goods or services to examine- Simple graph-Chart • 2. Country of Capeland • Shoes vs Watermelons- figures 1.4 • Vertical axis: shoes= 15 million • Horizontal axis: watermelons= 21 million • Opportunity cost thinking- smart???
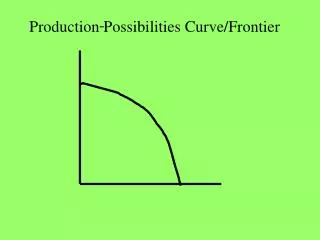
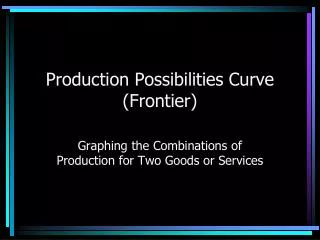
Another Way-”Production Possibilities Frontier” • 3rd alternative- figure 1.5” • Benefit of this thinking? Diversify!!!! • Thinking on “margin”- multiple possibilities and trade-offs • Both shoes and watermelons • The line drawn on the line graph is a “production possibilities frontier” • OPTIONS about Capeland’s production
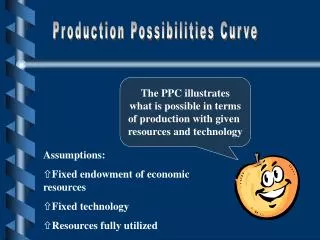
Efficiency, Growth & Cost • Graphs (Production possibilities) gives us a lot of information. • Efficiency, growth,opportunity costs of production of one good or another • Production Possibilities Frontier shows EFFICIENCY- maximizing output and use of resources in production. • Not all economies are efficient
Underutilization • Graph 1.5- any point inside of the graph represents underutilization of resources and production of goods. Fewer overall goods produced in economy. • Production of shoes and watermelon not at full potential
Growth • Production possibilities curve is a snapshot of of resources at a specific point in time • Real world- resources are “fluid” constantly flowing and changing • Quantitiy/Qualitiy of land, labor, resource • Growth = shift to right or increae “T” • Reasons???? See above LL&R • Decrease????????? “G”
Cost • Not necessarily monetary • Opportunity Cost- next best alternative • COST- one option vs another or sacrifice • COST figure 1.5 • 0 watermelons to 8 million tons = 1 million shoes (cost) ?? 8/1 • 2nd step- 14/2?? Incease of only 6- result?
Law of increasing costs • As production switches from from one item to another , more and more resources are necessary to increase production of 2nd item. • Switching from shoes to watermelons costs something • Shoes to watermelons show increasing costs • Expense of tradeoff-watermelon to shoes
Law of Increasing Costs • Figure 1.7 • In the example- why does cost increase? • What are resources best suited for? • Do resources & technology impact production choices? • Resources, skill of workers, technology