Download
1 / 7
70 likes | 158 Views
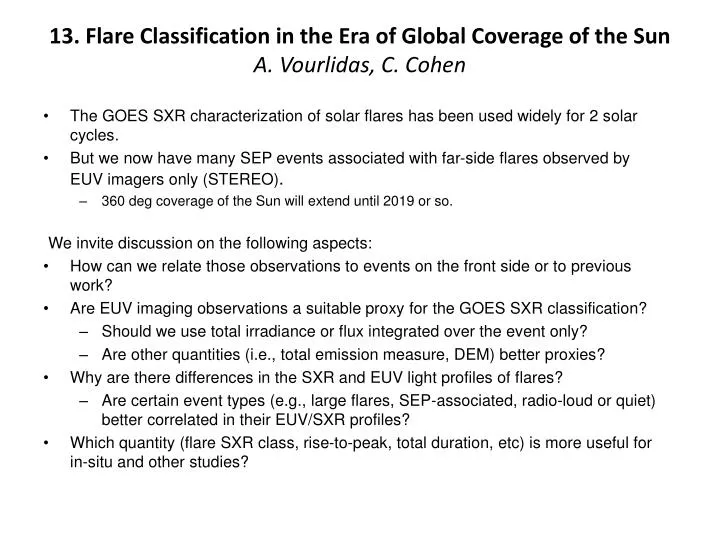
13. Flare Classification in the Era of Global Coverage of the Sun A. Vourlidas, C. Cohen. The GOES SXR characterization of solar flares has been used widely for 2 solar cycles. But we now have many SEP events associated with far-side flares observed by EUV imagers only (STEREO) .

E N D
13. Flare Classification in the Era of Global Coverage of the SunA. Vourlidas, C. Cohen • The GOES SXR characterization of solar flares has been used widely for 2 solar cycles. • But we now have many SEP events associated with far-side flares observed by EUV imagers only (STEREO). • 360 deg coverage of the Sun will extend until 2019 or so. We invite discussion on the following aspects: • How can we relate those observations to events on the front side or to previous work? • Are EUV imaging observations a suitable proxy for the GOES SXR classification? • Should we use total irradiance or flux integrated over the event only? • Are other quantities (i.e., total emission measure, DEM) better proxies? • Why are there differences in the SXR and EUV light profiles of flares? • Are certain event types (e.g., large flares, SEP-associated, radio-loud or quiet) better correlated in their EUV/SXR profiles? • Which quantity (flare SXR class, rise-to-peak, total duration, etc) is more useful for in-situ and other studies?
Flare-CME Statistics: Flare perspective SXR Peak Intensity vs Flare duration • Kay et al (2003): Flare Study • Flares with CMEs have longer duration, higher peak T, lower rise • Sample: 48 CME, 21 non-CME Flare Rise Time vs Decay Time SXR Peak Temperature vs Peak Intensity
Flare-CME statistics: CME perspective Velocity vs SXR Peak Flux • Vršnak et al (2005): Kinematic study. • No bimodal distribution found (speed or acceleration). • Continuous spectrum of events • Wider CMEs are faster • Weak-flare (B,C) CMEs similar to non-flare CMEs Black: M,X Grey: < M Velocity vs CME Width
The events shown below are some examples of “structured” events. In this family of events, the x-ray signal looks typical, similar to the “classical” flare, but the EUV signal has structure in it. The EUV shape does not follow the x-ray shape, and typically has multiple peaks. Slides provided by D. Mcmullin
Slides provided by D. Mcmullin The events shown on this page show a strong x-ray event with little or no corresponding EUV event. Also to note, the x-ray flare in these events is somewhat slower to peak, peak at a slightly lower value, but last for a relatively long time.
Slides provided by D. Mcmullin In these events, Timing is different between the x-ray event and the EUV event, or the shapes are unusual. The lower right panel shows surprising symmetry in the x-ray signature. Flare Rise Time vs Decay Time
Jan 17, 2010: A case for perpendicular diffusion? No clear anisotropy No clear velocity dispersion Electrons arrive late Courtesy of N. Dresing SPD-2011, A. Vourlidas