Download
1 / 14
150 likes | 159 Views
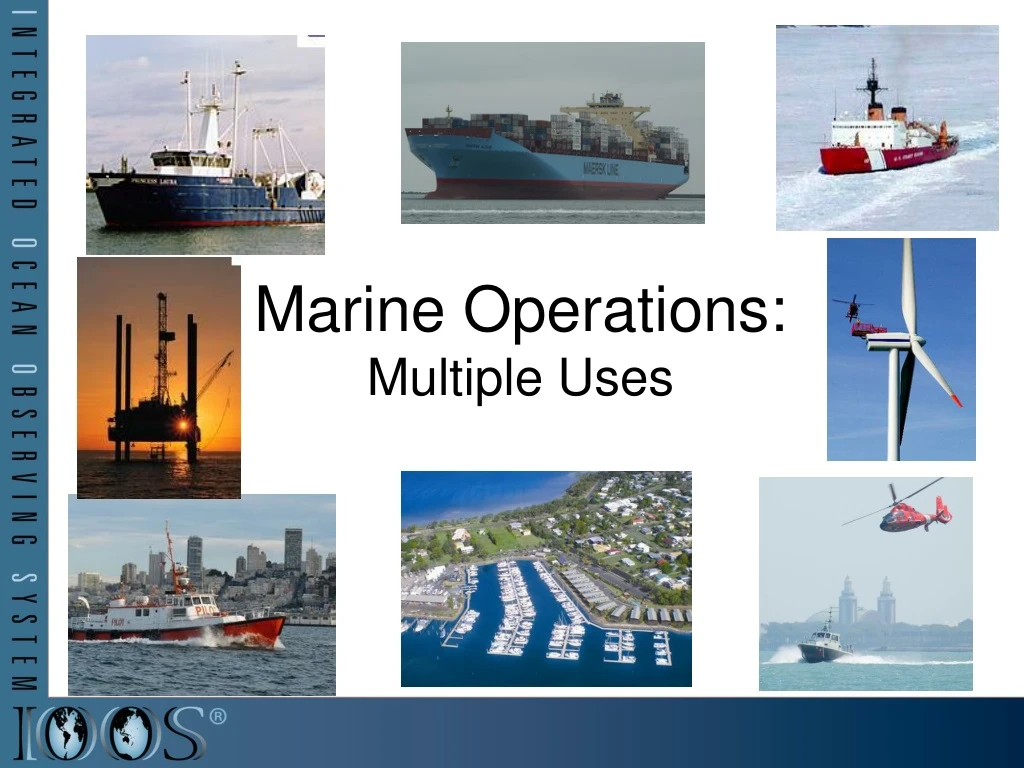
Marine Operations: Multiple Uses. Regional Association Activities Supporting Marine Operations: Multiple Responses - Navigation, Safety and Efficiency. Mass. Long Beach. NYC. Customized Products Integrating observations and model forecasts. Real Time Sea State Conditions. Oahu.

E N D
Regional Association Activities Supporting Marine Operations: Multiple Responses - Navigation, Safety and Efficiency Mass Long Beach NYC Customized Products Integrating observations and model forecasts Real Time Sea State Conditions Oahu San Francisco Cut text, AIS San Francisco Hudson Emergency Response Beach Safety Ship Tracking
Operational Partnerships Integrating IOOS Data: Multiple Delivery Methods • National Data Buoy Center • Serving non-federal data from RAs • Over 50% of data served by NDBC is from external partners, enabled by IOOS DMAC • Integrating IOOS data into NOAA’s PORTS • Waves: Chesapeake, San Francisco, Long Beach/Los Angeles and Mouth of Columbia River (through MOU with USACE & PORTS) • Currents: underway for NY/NJ Harbor • Methodology established that allows for other sites to be incorporated NDBC Station Count by Region
Commonalities Across Regions: IOOS Sponsored 2 National Plans • Developed with community support from academia, regions, and federal agencies (ACT facilitated plans) • Identified critical gaps, technical needs and data management requirements • Includes estimated cost based on decades of experience • Framework to facilitate leveraging Build-out scenarios
San Francisco Safety, Economics, Environment CDIP Point Reyes Buoy Long Period Swell CDIP San Francisco Bar Buoy USACE disposal site Short Period Seas USACE Project Site (Regional Sediment Management) NOAA 46026
SanFrancisco Wave Map Browser Safety, Efficiency Understanding of ManagementIssues
SanFrancisco - SAFETY Marine Incidents (rescues) near SF Bar Data supplied by the Coast Guard. Assimilated and Disseminated by the SF NWS Office. Incidents in the Vicinity of SF Bar (IVO)
“Building Relationships”Safety & Efficiency SF NWS “This buoy allows for safer transits, safer pilot boat operations, and efficiency for the shippers that call at San Francisco Bay.” Captain Bill Greig “The valuable information available from this weather buoy plays a very crucial roll in my decision that relates to safe navigation of ships across the bar.” Captain Carl Martin, Jr. “This station has been a great benefit to me as a San Francisco Bar Pilot in route planning and risk assessment.” Captain H.W. Kenyon Management Operations Adoption
U.S. Coast Guard: Search And Rescue Optimal Planning System Responders Mid-Atlantic Operational Data Flow to SAROPS National HF Radar Network – 151 Sites SAROPS 96-Hour Search Area:HF Radar= 12,000 km2 SAROPS 96-Hour Search Area: HYCOM = 36,000 km2
IOOS Mid-Atlantic Bight: High Frequency Radar (HFR) Coverage 2008 OI % Coverage 12 LR HFRs 2009 OI % Coverage 13 LR HFRs 2010 OI % Coverage 14 LR HFRs Annual Coverage Changes: 2008 to 2009 – Increase due to a focus on resiliency 2009 to 2010 – Decrease due to a lack of spares 2009 USCG Coverage Target: 80% Spatial Coverage 80% of the Time 2010 Staffing Requirements: MAB HFR Network = 14 LR HFRs + 14 SR HFRs. National HFR Plan Recommends 8 Technicians. IOOS Currently Supports 3 Technicians. 2008
April 20, 2010 – no systems operating IOOS Coordinated Rapid Response: Deepwater Horizon Oil Spill April 24, 2010 – USF systems online In 12 days, IOOS coordinated response resulted in 6 operating HF Radars in 2 networks May 1, 2010 – USM systems online
IOOS Coordinated Rapid Response: Deepwater Horizon Oil Spill Contributed Assets: HF Radar Networks USF, USM Gliders iRobot, Mote, Rutgers, SIO/WHOI, UDel, USF Drifters & Profilers Horizon Marine, Navy Satellite Imagery CSTARS, UDel Ocean Forecasts Navy, NCSU Data/Web Services ASA, Rutgers, SIO Tropical Storm Bonnie crosses the Gulf of Mexico USM HFR TS Bonnie USF HFR USM HFR validation of SABGOM Forecast in region with satellite detected oil slicks HFR used for Oil Slick Forecasts by NOAA/NOS/OR&R
IOOS Surface Current Mapping Applications: Derived Products Water Quality Fisheries Persistent Divergence (Upwelling) Positive Correlation w/ Upwelling Tracking pollution from the Tijuana River plume in Southern California Day 3 Negative Correlation w/ Downwelling Persistent Convergence (Downwelling) • Start Points • Stop Points Are there preferred locations for the fall Squid migration to the Middle Atlantic Bight outer continental shelf? IOOS + NMFS data indicate Squid prefer persistent upwelling zones. Day 0 3-Day Plume Dispersion
Discussion Questions • How do we continue to build the IOOS partnerships that support Maritime Operations? • How can we move forward with implementation of The National Wave Observation Plan and The National Surface Current Mapping Plan? • Are there additional National Plans that support Maritime Operations that IOOS could coordinate? Data Based – Water Levels. Technology Based – Gliders. Product Based – Ocean Current Forecast Ensembles. • What additional data acquisition, aggregation and product delivery methods can be leveraged to support Maritime Operations? How can this be facilitated?