Download
1 / 1
10 likes | 130 Views
QM2001.

E N D
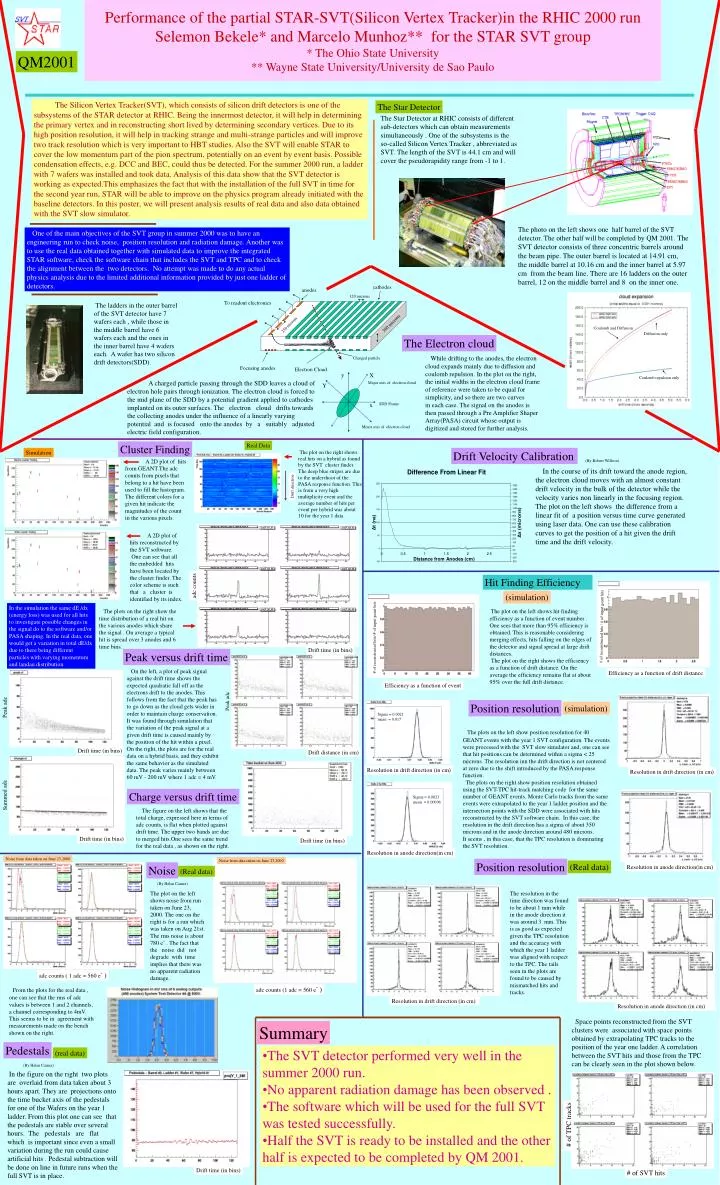
QM2001 The Silicon Vertex Tracker(SVT), which consists of silicon drift detectors is one of the subsystems of the STAR detector at RHIC. Being the innermost detector, it will help in determining the primary vertex and in reconstructing short lived by determining secondary vertices. Due to its high position resolution, it will help in tracking strange and multi-strange particles and will improve two track resolution which is very important to HBT studies. Also the SVT will enable STAR to cover the low momentum part of the pion spectrum, potentially on an event by event basis. Possible condensation effects, e.g. DCC and BEC, could thus be detected. For the summer 2000 run, a ladder with 7 wafers was installed and took data. Analysis of this data show that the SVT detector is working as expected.This emphasizes the fact that with the installation of the full SVT in time for the second year run, STAR will be able to improve on the physics program already initiated with the baseline detectors. In this poster, we will present analysis results of real data and also data obtained with the SVT slow simulator. The Star Detector Performance of the partial STAR-SVT(Silicon Vertex Tracker)in the RHIC 2000 runSelemon Bekele* and Marcelo Munhoz** for the STAR SVT group* The Ohio State University ** Wayne State University/University de Sao Paulo The Star Detector at RHIC consists of different sub-detectors which can obtain measurements simultaneously . One of the subsystems is the so-called Silicon Vertex Tracker , abbreviated as SVT. The length of the SVT is 44.1 cm and will cover the pseudorapidity range from -1 to 1. The photo on the left shows one half barrel of the SVT detector. The other half will be completed by QM 2001. The SVT detector consists of three concentric barrels around the beam pipe. The outer barrel is located at 14.91 cm, the middle barrel at 10.16 cm and the inner barrel at 5.97 cm from the beam line. There are 16 ladders on the outer barrel, 12 on the middle barrel and 8 on the inner one. One of the main objectives of the SVT group in summer 2000 was to have an engineering run to check noise, position resolution and radiation damage. Another was to use the real data obtained together with simulated data to improve the integrated STAR software, check the software chain that includes the SVT and TPC and to check the alignment between the two detectors. No attempt was made to do any actual physics analysis due to the limited additional information provided by just one ladder of detectors. cathodes anodes 120 microns To readout electronics The ladders in the outer barrel of the SVT detector have 7 wafers each , while those in the middle barrel have 6 wafers each and the ones in the inner barrel have 4 wafers each. A wafer has two silicon drift detectors(SDD). 300 microns 250 microns Coulomb and Diffusion Diffusion only The Electron cloud While drifting to the anodes, the electron cloud expands mainly due to diffusion and coulomb repulsion. In the plot on the right, the initial widths in the electron cloud frame of reference were taken to be equal for simplicity, and so there are two curves in each case. The signal on the anodes is then passed through a Pre Amplifier Shaper Array(PASA) circuit whose output is digitized and stored for further analysis. Charged particle Focusing anodes Electron Cloud y X Coulomb repulsion only A charged particle passing through the SDD leaves a cloud of electron hole pairs through ionization. The electron cloud is forced to the mid plane of the SDD by a potential gradient applied to cathodes implanted on its outer surfaces. The electron cloud drifts towards the collecting anodes under the influence of a linearly varying potential and is focused onto the anodes by a suitably adjusted electric field configuration. Major axis of electron cloud Y x SDD Frame Minor axis of electron cloud Real Data Cluster Finding Simulation The plot on the right shows real hits on a hybrid as found by the SVT cluster finder. The deep blue stripes are due to the undershoot of the PASA response function. This is from a very high multiplicity event and the average number of hits per event per hybrid was about 10 for the year 1 data. Drift Velocity Calibration A 2D plot of hits from GEANT.The adc counts from pixels that belong to a hit have been used to fill the histogram. The different colors for a given hit indicate the magnitudes of the count in the various pixels. (By Robert Willson) In the course of its drift toward the anode region, the electron cloud moves with an almost constant drift velocity in the bulk of the detector while the velocity varies non linearly in the focusing region. The plot on the left shows the difference from a linear fit of a position versus time curve generated using laser data. One can use these calibration curves to get the position of a hit given the drift time and the drift velocity. Drift direction A 2D plot of hits reconstructed by the SVT software. One can see that all the embedded hits have been located by the cluster finder. The color scheme is such that a cluster is identified by its index. Hit Finding Efficiency adc counts (simulation) In the simulation the same dE /dx (energy loss) was used for all hits to investigate possible changes in the signal do to the software and/or PASA shaping. In the real data, one would get a variation in total dE/dx due to there being different particles with varying momentum and landau distribution. The plots on the right show the time distribution of a real hit on the various anodes which share the signal . On average a typical hit is spread over 3 anodes and 6 time bins. The plot on the left shows hit finding efficiency as a function of event number . One sees that more than 95% efficiency is obtained. This is reasonable considering merging effects, hits falling on the edges of the detector and signal spread at large drift distances. The plot on the right shows the efficiency as a function of drift distance. On the average the efficiency remains flat at about 95% over the full drift distance. # of reconstructed hits / # of input geant hits # of reconstructed hits/ # of input geant hits Drift time (in bins) Peak versus drift time On the left, a plot of peak signal against the drift time shows the expected quadratic fall off as the electrons drift to the anodes. This follows from the fact that the peak has to go down as the cloud gets wider in order to maintain charge conservation. It was found through simulation that the variation of the peak signal at a given drift time is caused mainly by the position of the hit within a pixel. On the right, the plots are for the real data on a hybrid basis, and they exhibit the same behavior as the simulated data. The peak varies mainly between 60 mV - 200 mV where 1 adc = 4 mV. Efficiency as a function of drift distance Efficiency as a function of event Peak adc Position resolution (simulation) Peak adc Sigma = 0.0021 mean = 0.017 The plots on the left show position resolution for 40 GEANT events with the year 1 SVT configuration. The events were processed with the SVT slow simulator and, one can see that hit positions can be determined within a sigma < 25 microns. The resolution inn the drift direction is not centered at zero due to the shift introduced by the PASA response function. The plots on the right show position resolution obtained using the SVT-TPC hit-track matching code for the same number of GEANT events. Monte Carlo tracks from the same events were extrapolated to the year 1 ladder position and the intersection points with the SDD were associated with hits reconstructed by the SVT software chain. In this case, the resolution in the drift direction has a sigma of about 350 microns and in the anode direction around 480 microns. It seems , in this case, that the TPC resolution is dominating the SVT resolution. Drift time (in bins) Drift distance (in cm) Resolution in drift direction (in cm) Resolution in drift direction (in cm) Charge versus drift time Summed adc Sigma = 0.0023 mean = 0.00006 The figure on the left shows that the total charge, expressed here in terms of adc counts, is flat when plotted against drift time. The upper two bands are due to merged hits.One sees the same trend for the real data , as shown on the right. Drift time (in bins) Drift time (in bins) Resolution in anode direction(in cm) Noise from data taken on June 23,2000 Noise from data taken on June 23,2000 Position resolution (Real data) Noise Resolution in anode direction(in cm) (Real data) (By Helen Caines) The plot on the left shows noise from run taken on June 23, 2000. The one on the right is for a run which was taken on Aug 21st. The rms noise is about 780 e- . The fact that the noise did not degrade with time implies that there was no apparent radiation damage. The resolution in the time direction was found to be about 1 mm while in the anode direction it was around 3 mm. This is as good as expected given the TPC resolution and the accuracy with which the year 1 ladder was aligned with respect to the TPC. The tails seen in the plots are found to be caused by mismatched hits and tracks. adc counts ( 1 adc = 560 e- ) From the plots for the real data , one can see that the rms of adc values is between 1 and 2 channels, a channel corresponding to 4mV. This seems to be in agreement with measurements made on the bench shown on the right. adc counts (1 adc = 560 e- ) Resolution in drift direction (in cm) Resolution in anode direction (in cm) Space points reconstructed from the SVT clusters were associated with space points obtained by extrapolating TPC tracks to the position of the year one ladder. A correlation between the SVT hits and those from the TPC can be clearly seen in the plot shown below. Summary Pedestals • The SVT detector performed very well in the summer 2000 run. • No apparent radiation damage has been observed . • The software which will be used for the full SVT was tested successfully. • Half the SVT is ready to be installed and the other half is expected to be completed by QM 2001. (real data) (By Helen Caines) In the figure on the right two plots are overlaid from data taken about 3 hours apart. They are projections onto the time bucket axis of the pedestals for one of the Wafers on the year 1 ladder. From this plot one can see that the pedestals are stable over several hours. The pedestals are flat which is important since even a small variation during the run could cause artificial hits . Pedestal subtraction will be done on line in future runs when the full SVT is in place. # of TPC tracks Drift time (in bins) # of SVT hits