Download
1 / 25
250 likes | 452 Views
Charlie Moores. Inland Avian Predation. Fish Field Unit Nathan Zorich FPOM Avian Update McNary emphasis September 13, 2012. Tim Avery. Mike Baird. Fish eating bird colonies. (Roby, Collis et al. 2011). USACE Avian Management. Estuary. In-land. BiOp requirements.

E N D
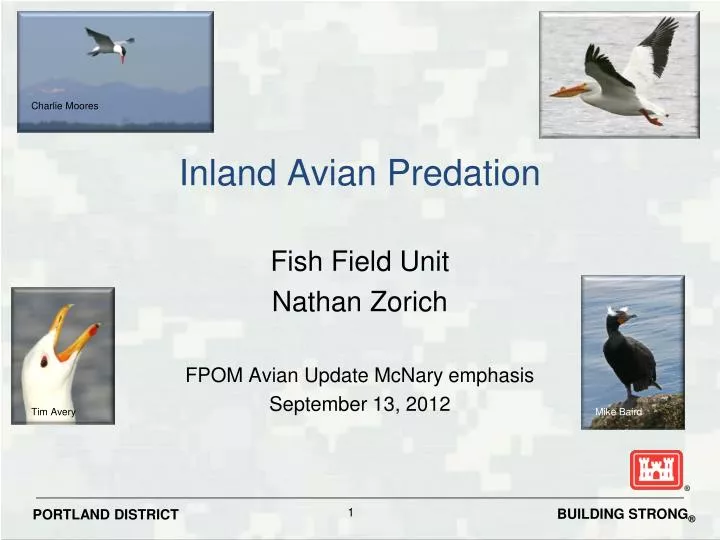
Charlie Moores Inland Avian Predation Fish Field Unit Nathan Zorich FPOM Avian Update McNary emphasis September 13, 2012 Tim Avery Mike Baird
Fish eating bird colonies (Roby, Collis et al. 2011)
USACE Avian Management Estuary In-land
BiOp requirements • Smolt survival 96% Spring & 93% Summer • Inland Avian Reasonable & Prudent Alternatives 47. Manage avian predators on Corps lands 48. Continue deterrents at dams 68. Monitor avian predators & smolt impacts • Needs Deterrent evaluation Long term monitoring Prioritize avian deterrent spending
Focused Monitoring : Fish Consumption Source: multiple: FFU studies
John Day Dam 2009* *Daily mean gull count n = 99 One dot = one gull
John Day Dam 2010* *Daily mean gull count n = 17 One dot = one gull
Gull CountsApril – July (foraging gulls / day) *April – 20 May 2010
Concerns from Project Biologist • Region wants current hazing or more • Unsustainable under O&M budget forecast • Benefits hazing vs. political reality? • JD Consumption: 6k (0.02%) of 31 M smolt in 2011 38k (0.27%) of 40 M smolt in 2010 (Zorich et al. 2011) • Maintenance cost of extensive line array JD • $6 M to build, 125 synthetic lines 3,000 ft. long • Maintenance will increase as lines age and fail