Download
1 / 1

E N D
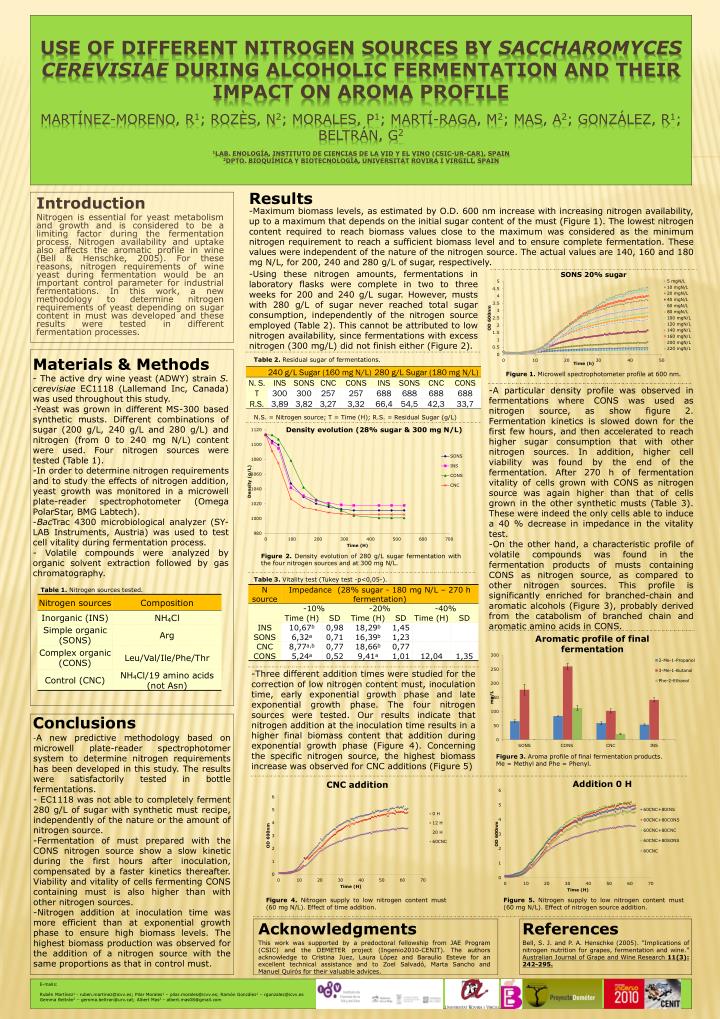
Introduction Nitrogen is essential for yeast metabolism and growth and is considered to be a limiting factor during the fermentation process. Nitrogen availability and uptake also affects the aromatic profile in wine (Bell & Henschke, 2005). For these reasons, nitrogen requirements of wine yeast during fermentation would be an important control parameter for industrial fermentations. In this work, a new methodology to determine nitrogen requirements of yeast depending on sugar content in must was developed and these results were tested in different fermentation processes. Use of different nitrogen sources by Saccharomycescerevisiae during alcoholic fermentation and their impact on aroma profileMartínez-Moreno, R1; Rozès, N2; Morales, P1; Martí-Raga, M2; Mas, A2; González, R1; Beltrán, G21Lab. Enología, Instituto de Ciencias de la Vid y el Vino (CSIC-UR-CAR), Spain2Dpto. Bioquímica y Biotecnología, UniversitatRoviraiVirgili, Spain Results • Maximum biomass levels, as estimated by O.D. 600 nm increase with increasing nitrogen availability, up to a maximum that depends on the initial sugar content of the must (Figure 1). The lowest nitrogen content required to reach biomass values close to the maximum was considered as the minimum nitrogen requirement to reach a sufficient biomass level and to ensure complete fermentation. These values were independent of the nature of the nitrogen source. The actual values are 140, 160 and 180 mg N/L, for 200, 240 and 280 g/L of sugar, respectively. • Using these nitrogen amounts, fermentations in laboratory flasks were complete in two to three weeks for 200 and 240 g/L sugar. However, musts with 280 g/L of sugar never reached total sugar consumption, independently of the nitrogen source employed (Table 2). This cannot be attributed to low nitrogen availability, since fermentations with excess nitrogen (300 mg/L) did not finish either (Figure 2). Materials & Methods - The active dry wine yeast (ADWY) strain S. cerevisiaeEC1118 (Lallemand Inc, Canada) was used throughout this study. -Yeast was grown in different MS-300 based synthetic musts. Different combinations of sugar (200 g/L, 240 g/L and 280 g/L) and nitrogen (from 0 to 240 mg N/L) content were used. Four nitrogen sources were tested (Table 1). -In order to determine nitrogen requirements and to study the effects of nitrogen addition, yeast growth was monitored in a microwell plate-reader spectrophotometer (Omega PolarStar, BMG Labtech). -BacTrac 4300 microbiological analyzer (SY-LAB Instruments, Austria) was used to test cell vitality during fermentation process. - Volatile compounds were analyzed by organic solvent extraction followed by gas chromatography. Table 2. Residual sugar of fermentations. Figure 1. Microwell spectrophotometer profile at 600 nm. • A particular density profile was observed in fermentations where CONS was used as nitrogen source, as show figure 2. Fermentation kinetics is slowed down for the first few hours, and then accelerated to reach higher sugar consumption that with other nitrogen sources. In addition, higher cell viability was found by the end of the fermentation. After 270 h of fermentation vitality of cells grown with CONS as nitrogen source was again higher than that of cells grown in the other synthetic musts (Table 3). These were indeed the only cells able to induce a 40 % decrease in impedance in the vitality test. • On the other hand, a characteristic profile of volatile compounds was found in the fermentation products of musts containing CONS as nitrogen source, as compared to other nitrogen sources. This profile is significantly enriched for branched-chain and aromatic alcohols (Figure 3), probably derived from the catabolism of branched chain and aromatic amino acids in CONS. N.S. = Nitrogen source; T = Time (H); R.S. = Residual Sugar (g/L) Figure 2. Density evolution of 280 g/L sugar fermentation with the four nitrogen sources and at 300 mg N/L. Table 3. Vitality test (Tukey test -p<0,05-). Table 1. Nitrogen sources tested. • Three different addition times were studied for the correction of low nitrogen content must, inoculation time, early exponential growth phase and late exponential growth phase. The four nitrogen sources were tested. Our results indicate that nitrogen addition at the inoculation time results in a higher final biomass content that addition during exponential growth phase (Figure 4). Concerning the specific nitrogen source, the highest biomass increase was observed for CNC additions (Figure 5) Conclusions -A new predictive methodology based on microwell plate-reader spectrophotomer system to determine nitrogen requirements has been developed in this study. The results were satisfactorily tested in bottle fermentations. - EC1118 was not able to completely ferment 280 g/L of sugar with synthetic must recipe, independently of the nature or the amount of nitrogen source. -Fermentation of must prepared with the CONS nitrogen source show a slow kinetic during the first hours after inoculation, compensated by a faster kinetics thereafter. Viability and vitality of cells fermenting CONS containing must is also higher than with other nitrogen sources. -Nitrogen addition at inoculation time was more efficient than at exponential growth phase to ensure high biomass levels. The highest biomass production was observed for the addition of a nitrogen source with the same proportions as that in control must. Figure 3. Aroma profile of final fermentation products. Me = Methyland Phe = Phenyl. Figure 4. Nitrogen supply to low nitrogen content must (60 mg N/L). Effect of time addition. Figure 5. Nitrogen supply to low nitrogen content must (60 mg N/L). Effect of nitrogen source addition. Acknowledgments This work was supported by a predoctoral fellowship from JAE Program (CSIC) and the DEMETER project (Ingenio2010-CENIT). The authors acknowledge to Cristina Juez, Laura López and BaraulioEsteve for an excellent technical assistance and to ZoelSalvadó, Marta Sancho and Manuel Quirós for their valuable advices. References Bell, S. J. and P. A. Henschke (2005). "Implications of nitrogen nutrition for grapes, fermentation and wine." Australian Journal of Grape and Wine Research 11(3): 242-295. E-mails: Rubén Martínez1 - ruben.martinez@icvv.es; Pilar Morales1 – pilar.morales@icvv.es; Ramón González1 – rgonzalez@icvv.es Gemma Beltrán2 – gemma.beltran@urv.cat; Albert Mas2 – albert.mas08@gmail.com