Download
1 / 50
500 likes | 635 Views
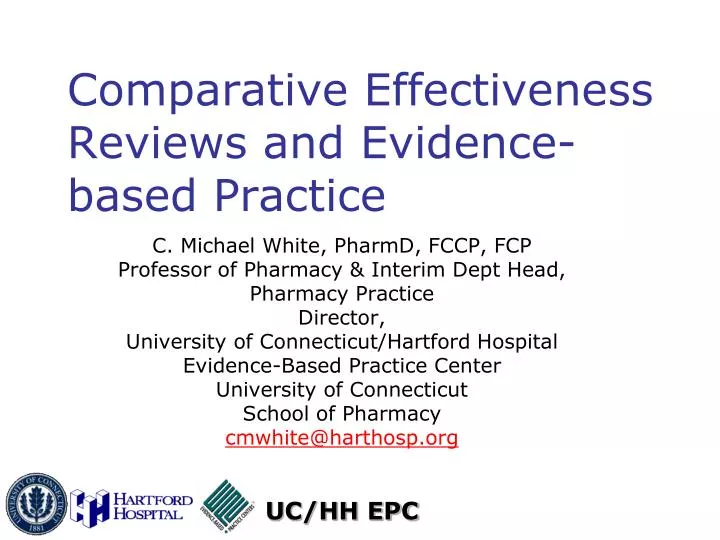
Comparative Effectiveness Reviews and Evidence-based Practice. C. Michael White, PharmD, FCCP, FCP Professor of Pharmacy & Interim Dept Head, Pharmacy Practice Director, University of Connecticut/Hartford Hospital Evidence-Based Practice Center University of Connecticut

E N D
Comparative Effectiveness Reviews and Evidence-based Practice C. Michael White, PharmD, FCCP, FCP Professor of Pharmacy & Interim Dept Head, Pharmacy Practice Director, University of Connecticut/Hartford Hospital Evidence-Based Practice Center University of Connecticut School of Pharmacy cmwhite@harthosp.org
Faculty Disclosure C. Michael White does not have any actual or potential conflict of interest in relation to this CE Activity
Learning Objectives • By attending this program, participants should be able to: • Identify and describe evidence based medicine • Identify and describe the fundamental components of a meta-analysis • Describe the importance of using meta-analysis in key areas of clinical practice
What is Happening in Healthcare? • Increase number and expense of tests and treatments available (60% of the growth in costs) • Monoclonal antibodies, ICDs, erythropoietin • Aging of Baby Boomers • Annual prescriptions filled increased by 1.5 billion over ten years • Healthcare costs exploded over 40 years • Cost have grown by 2.5X more than economy annually from 1960-present Emmanuel EJ. AHA QCOR Conference.
A Lot of Money Spent • $2.7 trillion spent on healthcare in 2008 • 1 out of every 6 dollars spent in US • How big is a trillion? • 1 billion seconds ago Richard Nixon resigned • 1 trillion seconds ago was 30,000 years BC • If spending continues to rise at this rate by 2082, 100% of GDP will be spent on healthcare • $200 billion spent on prescription drugs Emmanuel EJ. AHA QCOR Conference.
Evidence-Based Medicine Model: What is it? • “Evidence-based medicine is the conscientious, explicit and judicious use of current best evidence in making decisions about the care of individual patients.” • Not simply cookbook medicine but integration of evidence into practice and knowing when that evidence applies to particular patient and when it does not Sackett D. BMJ 1996;312:72.
Evidence-Based Medicine (EBM) • EBM benefits • Maximizes benefits • Encourages accountability • Enhances efficiency • Diminishes harms • EBM implementation • Develop consensus on evidence-based practice • Disseminate evidence and recommendations to decision-makers • Create incentives to practice EBM • Quality measures • Pay-for-performance Sackett DL. BMJ 1996;312:71–72.; Antman EM. JAMA 1992;268:240-8.; Alexander JA. Health Care Manage Rev 2007;32:150-9.
Where Does Evidence Come From? • Good evidence: • Both benefits and harms evaluated • Evaluated strong endpoints • Strong endpoints: survival, risk of MI, cancer recurrence rate, quality of life, cost-effectiveness • Weak endpoints: blood pressure, cholesterol, glucose • Evaluated effectiveness • Effectiveness includes efficacy and applicability • Subpopulations such as women, ethnic minorities, and other groups evaluated Treadwell JR. BMC 2006;6: doi:10.1186/1471-2288-6-52
Which Single Study Should You Use? Study 1 Study 2 Observed Effect + 40% Random Error + 5% True Effect + 30% Observed Effect + 30% Random Error + 5% True Effect + 30% Systematic Error + 5% Systematic Error - 5% Study 3 Study 4 Random Error - 5% Random Error - 5% True Effect + 30% Observed Effect + 30% True Effect + 30% Observed Effect + 20% Systematic Error - 5% Systematic Error + 5%
No, Believe Me, This Single Trial Tells The Whole Truth… No, No, There are No Other Good Trials…
Methodological Rigor in Reviews Individual Patient Data Meta-Analyses Systematic Review w/ Meta-Analyses Systematic Reviews w/o Meta-Analysis • Quantitative • Combine and analyze patient-level data from primary studies to estimate summary statistics • Infrequently seen because of cost, time, and data considerations Traditional, Narrative Reviews • Quantitative • Systematic evidence search with statistical analysis • Pool data from multiple studies to estimate summary statistics with confidence intervals • Qualitative • Formal methods to find studies but not to evaluate data • Comprehensive literature inclusion • Apply criteria to select high-quality studies • Describe results in evidence tables • Qualitative • Informal and subjective methodology • Selective, not comprehensive, literature identification • Rarely report literature selection criteria • Subject to systematic and personal biases Methodological Rigor LOW HIGH Shea B. BMC Medical Res Methodol 2007;7:10 doi:10.1186/1471-2288-7; Lau J. Lancet 1998;351:123-7. Pai M, National Medical Journal of India 2004;17:86-95.
Rationale for Using Systematic Reviews • Provide transparent and objective summary of large amounts of data • Help to cohere conflicting data/results of primary research • Form the basis of policymakers work (e.g., risk assessments, economic analyses) • Identify gaps in knowledge, helping define further avenues for research
Healthcare decision-makers need to critically evaluate and understand the value of a given meta-analysis If decision-makers simply accept the pooled result without exploring the meta-analysis further, they pass all the biases and limitations of the meta-analysis on to their decisions Meta-Analysis Caution!!!
Meta-Analysis: The Source Matters Multiple Poor Studies Meta-Analyzed
Publication Bias • Publication bias is the tendency of certain types of trials (such as those with the largest effects) to be published • Publication bias increases the risk that the observed effect might not reflect the true effect • May negatively impact consistency, precision, and magnitude of effect • Expanding searches to include additional languages, citation tracking, hand searching, and grey literature can help identify and possibly minimize publication bias AHRQ Methods Guide, Finding Evidence, Chapter 5.
Publication Bias Example • Study: 74 antidepressant studies registered with the FDA • 97% of positive studies published • 39% of neutral or negative studies published • 11 of 14 published in a way that conveyed the positive results but deemphasized the negative • When only published literature was meta-analyzed, a 32% increase in relative effect size occurred versus the more complete dataset of conducted trials Turner EH. NEJM 2008;358:252-60.
Detecting Publication Bias • Funnel Plots • A pictorial representation of each study plotted by its effect size on the horizontal axis and a measure of variance on the vertical axis. If the plot represents an inverted symmetrical funnel, it is said that publication bias is unlikely but publication bias cannot be excluded when any other configuration is shown. • Egger’s weighted regression statistics • Simpler to interpret compared to a funnel plot • Provides a p-value, if <0.05 indicates publication bias cannot be ruled out. • Begg’s test • A p-value <0.05 indicates publication bias cannot be ruled out. • Begg’s test requires a larger number of studies (>15-20) in order to provide robust results
Example of a Funnel Plot Egger’s p-value =0.51
Quantifying the Impact of Publication Bias • Duval and Tweedie (2000) • Developed the “Trim and Fill” method • Uses funnel plot symmetry to estimate the number of “missing” studies and the magnitudes of their effects. • Then, re-estimates the overall effect size after imputing potentially “missing” studies into the meta-analysis to determine if the results of the original analysis were replicated. Duval S, Tweedie R. Biometrics 2000;56:455-63
Heterogeneity • Between study differences • Some differences between studies is expected due to random variation (chance), but other causes are… • Clinical: Different patient populations, interventions, follow-up times, choice and measurement of outcome • Methodological: Different study designs, quality issues • Statistical: Numerical variation in treatment effects
How to Assess for Heterogeneity Summary meta-analysis plot [fixed effects] Summary meta-analysis plot [fixed effects] Study A Study A Study B Study B combined combined WMD (95% confidence interval) WMD (95% confidence interval) Low (No) Heterogeneity High Heterogeneity
How to Assess for Heterogeneity Statistically • Chi-squared test (Cochrane Q statistic) • Measures if observed variation is due to chance • This test is problematic and has lower power, so if there are few studies, it may not detect heterogeneity • A p-value <0.10 is typically considered significant • I2 (calculated from Q statistic) • Gives % of variation likely due to heterogeneity • <25% low heterogeneity; 25% - 75% moderate heterogeneity; >75% high heterogeneity Higgins et al. BMJ 2003; 327:557-60
How to Handle Heterogeneity • Use caution when pooling studies that are not similar clinically, or that have different study designs or where the treatment effects seem inconsistent • If there is a large amount of heterogeneity, explore it… • Use subgroup analyses and/or meta-regression and sensitivity analyses
Systematic Reviews and U.S. Policymakers • Findings from systematic reviews are being used increasingly by U.S. policymakers • Since 1999, the Centers for Medicare and Medicaid Services (CMS) has commissioned systematic reviews as a step in making national coverage decisions
AHRQ Evidence-Based Practice Centers • EPCs develop evidence reports and technology assessments on topics relevant to clinical, social science/behavioral, economic, and other health care organization and delivery issues— • Specifically those that are common, expensive, and/or significant for the Medicare and Medicaid populations http://www.ahrq.gov/clinic/epc/
Director: C. Michael White, Pharm.D., FCP, FCCP UCONN School of Pharmacy Co-Director/Methods Chief: Craig I. Coleman, Pharm.D. UCONN School of Pharmacy Associate Director/Medical Chief: Jeffrey Kluger, MD, FACC Hartford Hospital Project Manager: Diana Sobieraj, Pharm.D. Hartford Hospital Medical Librarian: Sharon Giovenale, MS UCONN School of Pharmacy Statistician: Jeffrey Mather, MS Hartford Hospital Supporting Investigators: William Baker, Pharm.D., BCPS Ripple Talati, Pharm.D., Vanita Tongbram, MBBS, MPH, Ajibade Ashaye, MBBS, MPH, Wendy Chen, Pharm.D., Jennifer Colby, Pharm.D., Jennifer Scholle, Pharm.D., Soyon Lee, Pharm.D. Hartford Hospital/UCONN School of Pharmacy Medical Editor: Robert Quercia, MS Hartford Hospital Content Experts: Jay Lieberman, MD, Charles Lapin, MD, Raymond McKay, MD, Francis Kiernan, MD, Isaac Silverman, MD, Jennifer Ellis, Pharm.D., Nancy Rodriguez, PhD, Others to Come Hartford Hospital, UCHC, CCMC, UCONN UCONN/HH EPC
Systematic Review Programmatic Themes Transfusion in Transplant VTE Ortho Surgery Guidelines Soluble Fibers Echinacea Herbs & Spices Early & Late Parkinson’s Benefits & Harms of Statins Restless Legs Syndrome Prevention of Atrial Fibrillation rhGH in Cystic Fibrosis Asthma/ COPD ACEI/ARB & DM Nephro ICDs CoQ10 & HF Warfarin/INR Control ACE I and ARBs in Preserved LV Function Magnesium Nutraceuticals Movement Disorders Cardiology Internal Medicine
ACE inhibitors or ARBs in CAD • ACE inhibitors and ARBs prolong survival in MI pts with LVD • What is the benefit in CAD pts with preserved LV function? • CMS discussing making ACE inhibitor or ARB use a performance measure • Needs CER to discern evidence
Mortality and Nonfatal MI Total Mortality Nonfatal MI Ann Intern Med 2009;151:861-71.
Stroke and Nonfatal MI Stroke Composite Endpoint Ann Intern Med 2009;151:861-71.
ACEIs and ARBs in Close Proximity to CABG or PTCA Total Mortality MI Stroke Ann Intern Med 2009;151:861-71.
Harms Associated with ACE Inhibitors Conclusions: Favorable balance of benefits to harms in most patients, but not for those recently undergoing CABG or PTCA
Systematic Review in Pediatrics • rhGH 0.27-0.35mg/kg/wk in CF • Trials are rhGH vs. no therapy except for one placebo controlled trial • Sample sizes are small, most underpowered • Perfect role for systematic review Phung OJ. Pediatrics 2010;21:347-54.
rhGH Improves Anthropometrics Height improves 3.13 cm more with rhGH Weight improves 1.48 kg more with rhGH
rhGH in CF: Pulmonary Function Absolute FEV1 improves 0.28 L more with rhGH Absolute FVC improves 0.67 L more with rhGH
rhGH in CF: Pulmonary Function % Predicted FEV1 nonsignificantly improves 2.43% more with rhGH
rhGH: Improves Bone Mineralization Bone mineral content improves 192g more with rhGH
rhGH: Hospitalizations 1.62 fewer hospitalizations per year (studies 6-12 mo)
rhGH on Final Health Outcomes • Mortality: no data • IV antibiotic use: no data • Osteopenia/porosis: no data • Pneumonia: no data • HRQoL: no data
rhGH: Harms • Serum glucose increases • HbA1c does not change • IGF-I concentrations significantly increase >100ng/mL with rhGH than with control • Found to be a marker of neoplasm in past observational studies • Cancer: no data
Balance of Benefits to Harms • rhGH reduces hospitalizations (SOE: Moderate) - an important intermediate outcome • rhGh therapy improves height, weight, and pulmonary function (SOE: Moderate) but may or may not impact final health outcomes • Epidemiologic links controversial • Absolute vs. % Predicted FEV1 • rhGH improves BMC (SOE: Low) • NaFl supplements improve bone mineral content but not fractures • Does rhGH reduce fractures? • Risk of DM low but possible risk of neoplasm (SOE: Low)
Grab Bag • Some misc results from our meta-analyses
What a Difference a Y-Chromosome Makes! ICD Survival Women = 12% HR Reduction, Not Significant Men = 36% HR Reduction Significant Henyan N. J Intern Med 2006;260:467-73.
Combined Cardiovascular Events by Gender with Statins Women 30% RR Reduction Men = 30% RR Reduction Dale KM. CMRO 2007;23:565-74.