Download
1 / 1
10 likes | 124 Views
Comparison of Microarray Data Generated from Degraded RNA using Five Different Target Synthesis Methods and Commercial Microarrays Scott Tighe and Tim Hunter Microarray Core Facility, Vermont Genetics Network at the University of Vermont, Burlington, Vermont, USA.

E N D
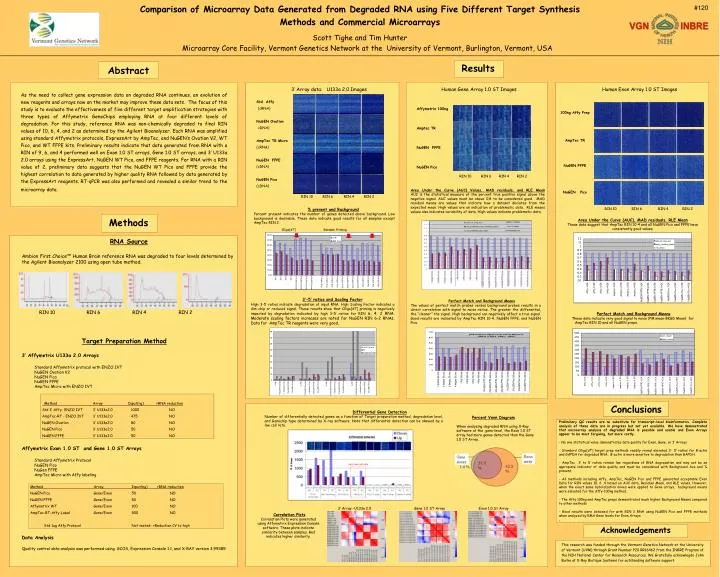
Comparison of Microarray Data Generated from Degraded RNA using Five Different Target Synthesis Methods and Commercial Microarrays Scott Tighe and Tim Hunter Microarray Core Facility, Vermont Genetics Network at the University of Vermont, Burlington, Vermont, USA 100ng Affy Prep AmpTec TR As the need to collect gene expression data on degraded RNA continues, an evolution of new reagents and arrays now on the market may improve these data sets. The focus of this study is to evaluate the effectiveness of five different target amplification strategies with three types of Affymetrix GeneChips employing RNA at four different levels of degradation. For this study, reference RNA was non-chemically degraded to final RIN values of 10, 6, 4, and 2 as determined by the Agilent Bioanalyzer. Each RNA was amplified using standard Affymetrix protocols, ExpressArt by AmpTec, and NuGEN’s Ovation V2, WT Pico, and WT FFPE kits. Preliminary results indicate that data generated from RNA with a RIN of 9, 6, and 4 performed well on Exon 1.0 STarrays, Gene 1.0 STarrays, and 3’ U133a 2.0 arrays using the ExpressArt, NuGEN WT Pico, and FFPE reagents. For RNA with a RIN value of 2, preliminary data suggests that the NuGEN WT Pico and FFPE provide the highest correlation to data generated by higher quality RNA followed by data generated by the ExpressArt reagents. RT-qPCR was also performed and revealed a similar trend to the microarray data. NuGEN FFPE NuGEN Pico Oligo[dT] Random Priming #120 Abstract Results 3’ Array data: U133a 2.0 Images Human Gene Array 1.0 ST Images Human Exon Array 1.0 ST Images Std Affy (cRNA) NuGEN Ovation cDNA) AmpTec TR Micro (cRNA) NuGEN FFPE (cDNA) NuGEN Pico (cDNA) Affymetrix 100ng Amptec TR NuGEN FFPE NuGEN Pico RIN 10 RIN 6 RIN 4 RIN 2 Area Under the Curve (AUC) Values, MAD residuals, and RLE MeanAUC is the statistical measure of the percent true positive signal above the negative signal. AUC values must be above 0.8 to be considered good. MAD residual means are values that indicate how a dataset deviates from the expected mean. High values are an indication of problematic data. RLE means values also indicates variability of data. High values indicate problematic data. RIN 10 RIN 6 RIN 4 RIN 2 RIN 10 RIN 6 RIN 4 RIN 2 % present and BackgroundPercent present indicates the number of genes detected above background. Low background is desirable. These data indicate good results for all samples except AmpTec RIN 2. Methods Area Under the Curve (AUC), MAD residuals, RLE MeanThese data suggest that AmpTec RIN 10-4 and all NuGEN Pico and FFPE have consistently good values. RNA Source Ambion First Choice™ Human Brain reference RNA was degraded to four levels determined by the Agilent Bioanalyzer 2100 using open tube method. 3’-5’ ratios and Scaling FactorHigh3-5’ ratios indicate degradation of input RNA. High Scaling Factor indicates a dim chip or reduced signal. These results show that Oligo[dT] priming is negatively impacted by degradation indicated by high 3-5’ ratios for RIN 6, 4, 2 RNA. Moderate scaling factors increases are noted for NuGEN RIN 6-2 RNAs. Data for AmpTec TR reagents were very good. Perfect Match and Background MeansThe values of perfect match probes verses background probes results in a direct correlation with signal to noise ratios. The greater the differential, the “cleaner” the signal. High background can negatively affect a true signal. Good results are indicated by AmpTec RIN 10-4, NuGEN FFPE, and NuGEN Pico. RIN 10 RIN 6 RIN 4 RIN 2 Perfect Match and Background Means These data indicate very good signal to noise (PM mean-BKGD Mean) for AmpTec RIN 10 and all NuGEN preps. Target Preparation Method 3’ Affymetrix U133a 2.0 Arrays Standard Affymetrix protocol with ENZO IVT NuGEN Ovation V2 NuGEN Pico NuGEN FFPE AmpTec Micro with ENZO IVT Affymetrix Exon 1.0 ST and Gene 1.0 ST Arrays Standard Affymetrix Protocol NuGEN Pico NuGen FFPE AmpTec Micro with Affy labeling Data Analysis Quality control data analysis was performed using GCOS, Expression Console 1.1, and X-RAY version 3.99385 Method Array Input(ng) rRNA reduction Std 3’ Affy- ENZO IVT 3’ U133a2.0 1000 NO AmpTec-RT - ENZO IVT 3’ U133a2.0 475 NO NuGEN Ovation 3’ U133a2.0 80 NO NuGEN Pico 3’ U133a2.0 50 NO NuGEN FFPE 3’ U133a2.0 50 NO Conclusions Differential Gene DetectionNumber of differentially detected genes as a function of Target preparation method, degradation level, and Genechip type determined by X-ray software. Note that differential detection can be skewed by a low call rate. Percent Venn DiagramWhen analyzing degraded RNA using X-Ray software at the gene-level, the Exon 1.0 ST array had more genes detected than the Gene 1.0 ST Array. Preliminary QC results are no substitute for transcript-level bioinformatics. Complete analysis of these data are in progress but not yet available. We have demonstrated that microarray analysis of degraded RNA is possible and usable and Exon Arrays appear to be most forgiving, but more costly. - No one statistical value demonstrates data quality for Exon, Gene, or 3’ Arrays - Standard Oligo[dT] target prep methods readily reveal elevated 3’- 5’ ratios for B-actin and GAPDH for degraded RNA. B-actin is more sensitive to degradation than GAPDH. - AmpTec 3’ to 5’ ratios remain low regardless of RNA degradation and may not be an appropiate indicator of data quality and must be considered with Background Ave and % present. - All methods including Affy, AmpTec, NuGEN Pico and FFPE generated acceptable Exon Data for RIN values 10, 6 ,4 based on AUC data, Residual Mean, and RLE values. However, when the exact same hybridization mixes were applied to Gene arrays, background means were elevated for the Affy-100ng method. - The Affy 100ng and AmpTec preps demonstrated much higher Background Means compared to other methods - Good results were obtained for with RIN 2 RNA using NuGEN Pico and FFPE methods when analyzed by RMA Gene levels for Exon Arrays . Method Array Input(ng) rRNA reduction NuGEN Pico Gene/Exon 50 NO NuGEN FFPE Gene/Exon 50 NO Affymetrix WT Gene/Exon 100 NO AmpTec-RT-Affy-Label Gene/Exon 500 NO Std 1ug Affy Protocol Not tested- rReduction CV to high 3’ Array –U133a 2.0 Gene 1.0 ST Array Exon 1.0 St Array Correlation Plots Correlation Plots were generated using Affymetrix Expression Console software. These plots indicate similarity between samples. Red indicates higher similarity. Acknowledgements This research was funded through the Vermont Genetics Network at the University of Vermont (UVM) through Grant Number P20 RR16462 from the INBRE Program of the NIH National Center for Research Resources. We Gratefully acknowlegde John Burke at X-Ray Biotique Systems for outstanding software support.