Download
1 / 42
420 likes | 427 Views
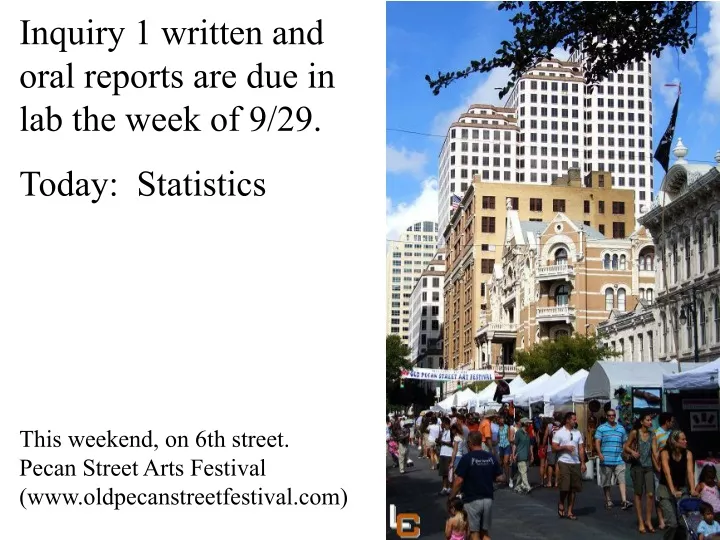
Inquiry 1 written and oral reports are due in lab the week of 9/29. Today: Statistics. This weekend, on 6th street. Pecan Street Arts Festival (www.oldpecanstreetfestival.com). Most statistical work can be done, and more easily done, by computer using programs such as: MS Excel SPSS SAS.

E N D
Inquiry 1 written and oral reports are due in lab the week of 9/29. Today: Statistics This weekend, on 6th street.Pecan Street Arts Festival (www.oldpecanstreetfestival.com)
Most statistical work can be done, and more easily done, by computer using programs such as: MS Excel SPSS SAS
Most statistical work can be done, and more easily done, by computer using programs such as: MS Excel is the most common. Available from UT for cheap, ~$30. If you have not used it, start practicing now.
The Basics: Mean, median, and mode
Mean- aka the average. Sum of all numbers divided by the number of data points. (14+17+7+6+4+11+8)/7 = 9.57
Median- the middle number of a group of ordered numbers 17 7 6 4 11 8 4 6 7 8 11 14 17 median is 8
Median- the middle number of a group of ordered numbers 17 7 6 4 11 8 6 7 8 11 14 17 median is 8 What about 4 6 7 11 14 17?
Median- the middle number of a group of ordered numbers 17 7 6 4 11 8 6 7 8 11 14 17 median is 8 What about 4 6 7 11 14 17? Median is 9.
Mode- the most common value in a group. 9, 8, 3, 4, 5, 2, 4, 5, 2, 3, 6, 1, 6, 2, 3, 9, 2, 6 Mode is 2
Why are there 3 ways to analyze a group of numbers? The mean is the most common form of analysis.
Why are there 3 ways to analyze a group of numbers? The mean is the most common form of analysis. 2, 3, 2, 4, 2, 7, 2, 5, 3, 2, 5, 4, 3, 5, 6, 121, 130 Mean = 18
Why are there 3 ways to analyze a group of numbers? 2, 3, 2, 4, 2, 7, 2, 5, 3, 2, 5, 4, 3, 5, 6, 121, 130 Mean = 18 Is this an accurate representation of these numbers?
Why are there 3 ways to analyze a group of numbers? 2, 2, 2, 2, 2, 3, 3, 3, 4, 4, 5, 5, 5, 6, 7, 121, 130 Median = 4 Mean = 18 Median can be more accurate when there are a few especially large or small numbers.
What is your favorite color? Mode can be used with non-numerical data.
Is there a numerical way to determine the accuracy of our analysis? 2, 2, 2, 2, 2, 3, 3, 3, 4, 4, 5, 5, 5, 6, 7, 121, 130 Median = 4 Mean = 18
Is there a numerical way to determine the accuracy of our analysis? 2, 2, 2, 2, 2, 3, 3, 3, 4, 4, 5, 5, 5, 6, 7, 121, 130 Median = 4 Mean = 18 Standard Deviation is a measure of variability.
Standard deviation is a measure of variability. The standard deviation is the root mean square (RMS) deviation of the values from their arithmetic mean. where ∑ = Sum of X = Individual score M = Mean of all scores N = Sample size (Number of scores)
Is there a numerical way to determine the accuracy of our analysis? 2, 2, 2, 2, 2, 3, 3, 3, 4, 4, 5, 5, 5, 6, 7, 121, 130 Mean = 18 Standard deviation = 40.5 Standard deviation is a measure of variability.
Is there a numerical way to determine the accuracy of our analysis? 2, 2, 2, 2, 2, 3, 3, 3, 4, 4, 5, 5, 5, 6, 7 Mean = 3.67 Standard deviation = 1.6 Standard deviation is a measure of variability.
Is there a numerical way to determine the accuracy of our analysis? 2, 2, 2, 2, 2, 3, 3, 3, 4, 4, 5, 5, 5, 6, 7(121, 130) Mean = 3.67 Median was 4
Is there a numerical way to determine the accuracy of our analysis? 2, 2, 2, 2, 2, 3, 3, 3, 4, 4, 5, 5, 5, 6, 7 Mean = 3.67 ±1.6 Standard deviation is a measure of variability.
Percent of data at 1, 2, or 3 standard deviations from the mean 3.7 2.1 5.3 0.5 6.9 -1.1 8.5 http://www.westgard.com/lesson34.htm
2, 2, 2, 2, 2, 3, 3, 3, 4, 4, 5, 5, 5, 6, 7 3.7 8/15=53% 2.1 5.3 14/15=93% 0.5 6.9 -1.1 8.5 15/15=100% http://www.westgard.com/lesson34.htm
Standard deviation can also be used to determine if 2 data sets are statistically different.
Standard deviation can also be used to determine if 2 data sets are statistically different… Set 1= 2, 2, 2, 2, 2, 3, 3, 3, 4, 4, 5, 5, 5, 6, 7 Mean = 3.67 ±1.6 And Set 2= 8, 6, 7, 8, 9, 5, 6, 7, 9, 8, 9, 5 Mean = 7.25 ± 1.48
Do the standard deviations overlap? Set 1= 2, 2, 2, 2, 2, 3, 3, 3, 4, 4, 5, 5, 5, 6, 7 Mean = 3.67 ±1.6 range = 2.07 to 5.27 And Set 2= 8, 6, 7, 8, 9, 5, 6, 7, 9, 8, 9, 5 Mean = 7.25 ± 1.48 range = 5.77 to 8.73 No overlap, might be different
Do the standard deviations overlap? Set 1= 2, 2, 2, 2, 2, 3, 3, 3, 4, 4, 5, 5, 5, 6, 7 Mean = 3.67 ±1.6 range = 2.07 to 5.27 And Set 2= 8, 6, 7, 8, 9, 5, 6, 7, 9, 8, 4, 5 Mean = 6.83 ± 1.64 range = 5.19 to 8.47 Overlap, different means, but might not be a statistically significant difference
How significant of a difference is this? Set 1= 2, 2, 2, 2, 2, 3, 3, 3, 4, 4, 5, 5, 5, 6, 7 Mean = 3.67 ±1.6 range = 2.07 to 5.27 And Set 2= 8, 6, 7, 8, 9, 5, 6, 7, 9, 8, 9, 5 Mean = 7.25 ± 1.48 range = 5.77 to 8.73 No overlap, might be different
The ‘Students’ T-test is a method to assign a numerical value of statistical difference.
X1–X2 T= Sx1 Sx2 2 2 + n1 n2 The ‘Students’ T-test is a method to assign a numerical value of statistical difference.
X1–X2 T= Sx1 Sx2 2 2 + n1 n2 The ‘Students’ T-test is a method to assign a numerical value of statistical difference. T is then used to look up the P-value from a table. Also need ‘degrees of freedom’= (n1+n2)-1.
How significant of a difference is this? Using MS Excel to get a P value = 3.44x10⁻⁶. Set 1= 2, 2, 2, 2, 2, 3, 3, 3, 4, 4, 5, 5, 5, 6, 7 Mean = 3.67 ±1.6 And Set 2= 8, 6, 7, 8, 9, 5, 6, 7, 9, 8, 9, 5 Mean = 7.25 ± 1.48
How significant of a difference is this? MS Excel P value = 3.44x10⁻⁶. So the chance that these 2 sets of data are significantly different is 1 - 3.44x10⁻⁶ or 0.999996559 Set 1= 2, 2, 2, 2, 2, 3, 3, 3, 4, 4, 5, 5, 5, 6, 7 Mean = 3.67 ±1.6 And Set 2= 8, 6, 7, 8, 9, 5, 6, 7, 9, 8, 9, 5 Mean = 7.25 ± 1.48
How significant of a difference is this? MS Excel P value = 3.44x10⁻⁶. So the chance that these 2 sets of data are significantly different is 1 - 3.44x10⁻⁶ or 0.999996559We can be 99.9996559% certain that the difference is statistically significant. Set 1= 2, 2, 2, 2, 2, 3, 3, 3, 4, 4, 5, 5, 5, 6, 7 Mean = 3.67 ±1.6 Set 2= 8, 6, 7, 8, 9, 5, 6, 7, 9, 8, 9, 5 Mean = 7.25 ± 1.48
Overlap, different means, but might not be a statistically significant difference Set 1= 2, 2, 2, 2, 2, 3, 3, 3, 4, 4, 5, 5, 5, 6, 7 Mean = 3.67 ±1.6 range = 2.07 to 5.27 Set 2= 8, 6, 7, 8, 9, 5, 6, 7, 9, 8, 4, 5 Mean = 6.83 ± 1.64 range = 5.19 to 8.47 MS Excel P-value = 4.41 x 10⁻⁵
What is, or is not, a statistically significant difference? 20% random difference : 80% confidence 10% random difference : 90% confidence 5% random difference : 95% confidence 1% random difference : 99% confidence 0.1% random difference : 99.9% confidence
Generally a P-value of 0.5 or less is considered a statistically significant difference. 20% random difference : 80% confidence 10% random difference : 90% confidence 5% random difference : 95% confidence 1% random difference : 99% confidence 0.1% random difference : 99.9% confidence
Standard deviation is NOT a valid method for determining statistical signifigance. T-test is one valid and accurate method for determining if 2 means have a statistically significant difference, or if the difference is merely by chance.
Inquiry 1 written and oral reports are due in lab the week of 9/29. more Statistics next week This weekend, on 6th street.Pecan Street Arts Festival (www.oldpecanstreetfestival.com)