Download
1 / 82
820 likes | 950 Views
The BeamCal Simulation Project Progress Report Keith Drake, Tera Dunn, Jack Gill, Gleb Oleinik , Uriel Nauenberg University of Colorado at Boulder. Beam Calorimeter Studies. Two photon process cross section about 10 5 larger than

E N D
The BeamCal Simulation Project • Progress Report • Keith Drake, Tera Dunn, Jack Gill, • Gleb Oleinik, Uriel Nauenberg • University of Colorado at Boulder
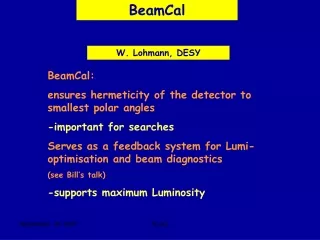
Beam Calorimeter Studies Two photon process cross section about 105 larger than SUSY cross section. Serious source of background for SUSY if not tagged . Pointed out by our group around 1998
2 Photon Process e+ e+ Very forward into BEAMCAL - - γ q , l Very forward into BEAMCAL in the detector γ q , l e- e-
Lumi Cal -7 mrad ent. 7 mrad exit Beam Cal
Solenoid field keeps the low energy charged particle in the forward direction. Beam hole is at 7 mrad. Need to add an x field component to move low energy charged particles in the 7 mrad direction. Anti-DiD • dipole field proposed by Andrei Seryi.
Beamstrahlung e+e- pairs. Energy deposited in 0.25 x0.25 cm2 cells.
Outside Beam Pipe Integrated Energy into the Beam Pipe is ~TeV
Shower in Beamcal from 2 γ process alone side view head-on view core of shower Radius of 25 mm Radius of 25 mm
head on view side view beamstrahlung electron from 2γ process
Beamstrahlung Energy Deposition in a Tile Tile at start of BeamCal Tile 3.0 cm in
Beamstrahlung Energy Deposition in a Tile Tile 6.0 cm in Tile 4.7 cm in
Consequences of Beamstrahlung Energy • Deposition • Energy Deposition is not Gaussian until one reaches a depth > 3 cms. • Distribution is very wide and hence affects energy resolution if we subtract an average value. • This problem is seen in the study how to measure the electron/positron energies. Resolution.
Electron from 2 photon overlayed Beamstrahlung Beamstrahlung with average subtracted
Clustering Cuts in Depth and Energy, Example 1 Beamstrahlung + Electron from 2-photon Beamstrahlung Alone Cut 30 mm Work in Progress Cut 10 MeV
Clustering Cuts in Depth and Energy, Example 2 Beamstrahlung + Electron from 2-photon Beamstrahlung Alone
Clustering Cuts in Depth and Energy, Example 3 Beamstrahlung + Electron from 2-photon Beamstrahlung Alone
Energy observed as a function of distance from center of BeamCal φ r Exit Beam Pipe Entrance Beam Pipe Δφ = 5 deg Δr = 1 mm
Energy Deposition versus r and φ Φ=0.0 Φ=30.0 30.0 Effect of Exit Beam Pipe Effect of Exit Beam Pipe Distance from center of beamcal (mm) Distance from center of beamcal (mm)
Energy Deposition versus r and φ Φ=150.0 Φ=180.0 150.0 180.0 Effect of Entrance Beam Pipe Effect of Entrance Beam Pipe Distance from center of beamcal (mm) Distance from center of beamcal (mm)
sensors Within a radius of 25mm no clustering Full detector Full Detector with clustering
Fraction of Energy Observed within a Radius of 0.5 cm of Electron Path No clustering cuts With clustering cuts
Fraction of Energy Observed within a Radius of 1.0 cm of Electron Path No clustering cuts With clustering cuts
Fraction of Energy Observed within a Radius of 2.0 cm of Electron Path With clustering cuts No clustering cuts
Fraction of Energy Observed within a Radius of 3.0 cm of Electron Path
Energy Resolution of High Energy Electrons {E(measured)- E(expected)} /E(expected) Best Possible Resolution No Beamstrahlung effects included
Energy Resolution of High Energy Electrons {E(measured)- E(expected)} /E(expected) Energy Resolution with Beamstrahlung Included. Average Substracted. Only energy deposited in a 25 mm radius from maximum. Sum energy over full Beamcal thickness. Effect of Beamstrhalung fluctuation in resolution clearly has an effect
Energy Resolution of High Energy Electrons {E(measured)- E(expected)} /E(expected) Energy Resolution. Beamstrahlung Included and Average Substracted. Measurements from 3.0 cm in and Including only cells with more than 10 MeV energy deposited.
Energy resolution of the reconstruction of the electrons from 2-photon events including the effects of beamstrahlung Preliminary results Preliminary results Using Bayesian Statistical Analysis
Case of no Beamstrahlung Included in analysis Case of Best Analysis with Beamstrahlung Included. Exit Beam Pipe Region Exit Beam Pipe Region
Reason for Resolution Tail Measured Energy loss due to cuts
Work to be Done • Understand the low energy tails of the energy resolution distribution. Develop a better scan. • What is the missing Pt distribution of 2 photon events given the resolution. • Study the resolution of new geometries.
Work to be Done • Optimize signal to Background. • Check all our Calculations. • Find other analysis techniques that reduce the beamstrahlung fluctuations and hence improve the signal resolution. • Study the effect of this analysis on SUSY signal. Missing Pt limits.
Study of a Scintillator Calorimeter • We are simulating a scintillator based calorimeter where the tiles • are offset in alternate layers. We are making now a great deal of progress.
γ s are well separated 5 cm 100 GeV 100 GeV π0 mostly low p
ALCPG Geometrical Arrangement 5 cm Scintillator Panels Worst separation 1.25 cm · · · · φ ····· 0 0.5 1.0 0.25 0.75 θ Best separation
Track Following into the Calorimeter Low momentum curlers
Cluster Correlation with Charged Tracks Success Probability Energy cluster in the calorimeter associated with a charged track interaction Success Conclude that it is a neutral cluster Failure
ALCPG • The Chi-Square Structure • μi = average photon energy deposited in ith tile • σi = standard deviation in the energy deposition • Hij = σi σj • χ2 = Σ (xi – μi )Hij (xj – μj ) • where xi is the energy deposited by the shower being tested in the ith tile. 9 -1 i,j =1
We are now in the middle of trying to separate • photon clusters by means of the chi-square • method. Hard problem. Crucial aspect of • pattern recognition and calorimeter resolution.
Fitted γ direction from shower energy distribution Z vs R 50 GeV 20 GeV
Study of the Characteristics of • Silicon Photomultipliers
New Silicon Photo-Detectors Bias Voltage ~40 volts Photonique, SA Pulsar, Russia + Moscow Eng. Physics Inst. 2mm Scintillator performance
2mm scint., cosmic rays 0 < t < 200 nsec 20 < t < 70 nsec 1 photo elec. Similar resolution 5 photo elec. Need to Improve Resolution 8 photo elec.