Download
1 / 17
250 likes | 605 Views
Sistem Informasi Geografis. Konsep Dasar SIG. Aurelio Rahmadian. Definisi. System that captures, stores, analyzes, manages, and presents data that are linked to location(s). In the simplest terms, GIS is the merging of cartography, statistical analysis, and database technology. Sejarah.

E N D
SistemInformasiGeografis KonsepDasar SIG Aurelio Rahmadian
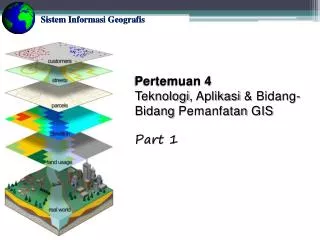
Definisi • System that captures, stores, analyzes, manages, and presents data that are linked to location(s). • In the simplest terms, GIS is the merging of cartography, statistical analysis, and database technology.
Sejarah • The first computerized GIS began its life in 1960’s as a project of the Rehabilitation and Development Agency Program within the government of Canada. The Canada Geographic Information System (CGIS) was designed to analyze Canada's national land inventory data to aid in the development of land for agriculture. • CGIS was used to store, analyze, and manipulate data collected for the Canada Land Inventory (CLI) – an effort to determine the land capability for rural Canada by mapping information about soils, agriculture, recreation, wildlife, waterfowl, forestry, and land use at a scale of 1:50,000. • CGIS developed by Dr. Roger Tomlinson.
Sejarah • In 1964, Howard Fisher established the Harvard Lab for Computer Graphics where many of the industries early leaders studied. • The Harvard Lab produced a number of mainframe GIS applications including: SYMAP (Synagraphic Mapping System),CALFORM, SYMVU, GRID, POLYVRT, and ODYSSEY. • ODYSSEY was first modern vector GIS and many of its features would form the basis for future commercial applications.
Sejarah • In 1969, Jack Dangermond, who studied at the Harvard Lab for Computer Graphics, co-founded Environmental Systems Research Institute (ESRI) with his wife Laura. • ESRI would become in a few years the dominate force in the GIS marketplace and create ArcInfo and ArcView software. • Some of the popular commercial applications launched during this period include: ArcInfo, ArcView, MapInfo, SPANS GIS, PAMAP GIS, INTERGRAPH, and SMALLWORLD.
Fungsi • GIS allows us to view, understand, question, interpret, and visualize data in many ways that reveal relationships, patterns, and trends in the form of maps, reports, and charts. • A GIS helps you answer questions and solve problems by looking at your data in a way that is quickly understood and easily shared.
Fungsi • Map Where Things Are • Map Quantities • Map Densities • Find What's Inside • Find What's Nearby • Map Change
ASK • Approaching a problem geographically involves framing the question from a location-based perspective. What is the problem you are trying to solve or analyze, and where is it located?
ACQUIRE • After clearly defining the problem, it is necessary to determine the data needed to complete your analysis and ascertain where that data can be found or generated. The type of data and the geographic scope of your project will help direct your methods of collecting data and conducting the analysis.
EXAMINE • You will not know for certain if the data you have acquired is appropriate for your study until you actually examine it. The data ultimately selected for your analysis depends on your original question or questions as well as the results that you are seeking and how those results will be used.
ANALYZE • The data is processed and analyzed based on the method of examination or analysis you choose, which is dependent on the results you hope to achieve.
ACT • The results and presentation of the analysis are important parts of The Geographic Approach. The results can be shared through reports, maps, tables, and charts and delivered in printed form or digitally over a network or on the Web. You need to decide on the best means for presenting your analysis. You can compare the results from different analyses and see which method presents the information most accurately.
Aplikasi • Bisnis • Transportasi • Politik • Perbankan & Keuangan • Perpajakan & Pertanahan • Jurnalistik & Reportase • Periklanan • Sensus & Statistik • Pariwisata • Penentuan Lokasi Rawan Bencana
TUGAS • Makalah (maksimal 16/3/2011) - DasarTeori SIG - LatarBelakangMasalah - Aplikasi SIG berdasarpendekatan geografis • Presentasi
TanggalKelompok 23/2/2011 1 – 3 2/3/2011 4 – 5
Referensi • Chang, K.-Tsung. 2008. Introduction to Geographic Information Systems. McGraw Hill, Boston. • BETTINGER, Pete. 2004. Geographic Information Systems. McGraw Hill, Boston. • Budiyanto, E. 2005. SistemInformasiGeografismenggunakan ARC View GIS. Edisi 2. PenerbitAndi, Yogyakarta. • Prahasta, E. 2005. SisteminformasiGeografis:Tutorialarcview. PenerbitInformatika, Bandung. • Prahasta, E. 2005. Pengembanganaplikasi SIG denganmenggunakan Borland Delphi, Ms, Visual Basic & MapBasic. PenerbitInformatika, Bandung. • Prahasta, E. 2007. SistemInformasiGeografis: membangunaplikasi Web-based GIS denganMapServer. PenerbitInformatika, Bandung. • Prahasta, E. 2009. Sistem Informasi Geografis : Konsep-konsep Dasar (Perspektif Geodesi & Geomatika). Penerbit Informatika. Bandung.